
 Nasdaq
 华尔街日报
华尔街日报3 TSX Penny Stocks With Market Caps Up To CA$80M
The Canadian market has been marked by a focus on diversification, with investors encouraged to overweight sectors like energy and materials while being cautious about overconcentration in single themes such as AI. Penny stocks, though an older term, continue to represent an intriguing investment area for those looking at smaller or newer companies with potential for growth. By identifying penny stocks that demonstrate strong financial health and a clear growth trajectory, investors can uncover valuable opportunities within this niche segment of the market.
Top 10 Penny Stocks In Canada
| Name | Share Price | Market Cap | Rewards & Risks |
| Westbridge Renewable Energy (TSXV:WEB) | CA$2.15 | CA$54.35M | ✅ 3 ⚠️ 4 View Analysis > |
| Canso Select Opportunities (TSXV:CSOC.A) | CA$4.75 | CA$21.97M | ✅ 2 ⚠️ 2 View Analysis > |
| Sailfish Royalty (TSXV:FISH) | CA$3.48 | CA$265.37M | ✅ 1 ⚠️ 4 View Analysis > |
| Zoomd Technologies (TSXV:ZOMD) | CA$1.145 | CA$115.41M | ✅ 4 ⚠️ 2 View Analysis > |
| Montero Mining and Exploration (TSXV:MON) | CA$0.43 | CA$3.59M | ✅ 2 ⚠️ 4 View Analysis > |
| CEMATRIX (TSX:CEMX) | CA$0.335 | CA$50.24M | ✅ 3 ⚠️ 1 View Analysis > |
| Thor Explorations (TSXV:THX) | CA$1.37 | CA$911.46M | ✅ 3 ⚠️ 2 View Analysis > |
| Automotive Finco (TSXV:AFCC.H) | CA$1.17 | CA$23.19M | ✅ 2 ⚠️ 3 View Analysis > |
| Pulse Seismic (TSX:PSD) | CA$3.20 | CA$162.31M | ✅ 2 ⚠️ 1 View Analysis > |
| Hemisphere Energy (TSXV:HME) | CA$1.97 | CA$186.41M | ✅ 3 ⚠️ 2 View Analysis > |
Click here to see the full list of 388 stocks from our TSX Penny Stocks screener.
Underneath we present a selection of stocks filtered out by our screen.
Arrow Exploration (TSXV:AXL)
Simply Wall St Financial Health Rating: ★★★★★☆
Overview: Arrow Exploration Corp. is a junior oil and gas company focused on acquiring, exploring, developing, and producing oil and gas properties in Colombia and Western Canada, with a market cap of CA$74.32 million.
Operations: The company generates revenue of $76.79 million from its oil and gas exploration and production activities.
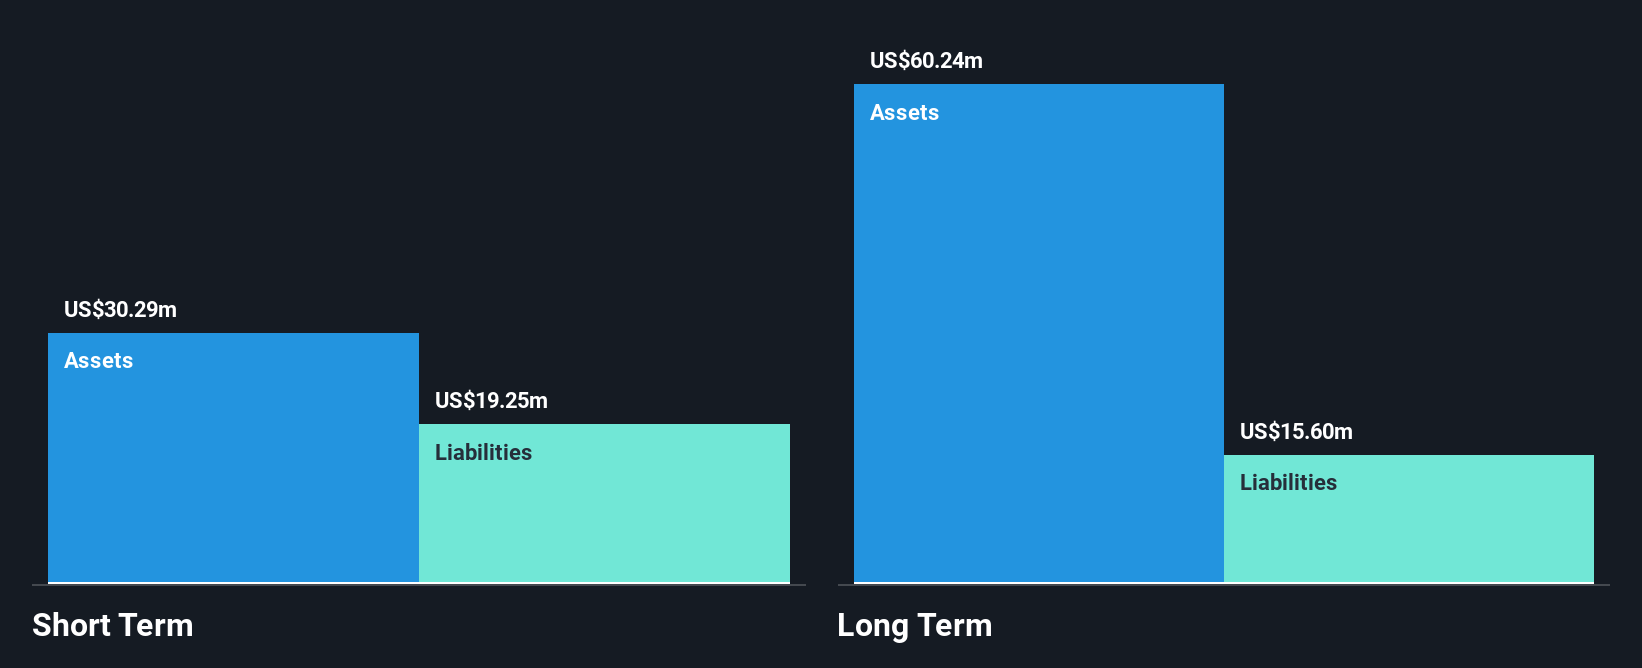
Market Cap: CA$74.32M
Arrow Exploration Corp. has shown significant earnings growth, with a very large increase of 1048.2% over the past year, outpacing the broader oil and gas industry. The company is debt-free and maintains stable short-term financial health, as its short-term assets exceed liabilities. However, it faces challenges with long-term liabilities not fully covered by current assets. Recent operational updates highlight successful drilling activities in Colombia's Mateguafa Attic field, contributing to steady production levels around 4,510 boe/d despite some temporary setbacks like the Mateguafa Oeste-1 well abandonment due to non-economic discoveries.
- Take a closer look at Arrow Exploration's potential here in our financial health report.
- Gain insights into Arrow Exploration's future direction by reviewing our growth report.
NexgenRx (TSXV:NXG)
Simply Wall St Financial Health Rating: ★★★★★★
Overview: NexgenRx Inc. operates in Canada, providing administration, adjudication, and payment services for drug, dental, and other extended health-care claims for beneficiaries of health benefit plans with a market cap of CA$28.45 million.
Operations: The company's revenue is derived from CA$17.71 million in benefits administration services.
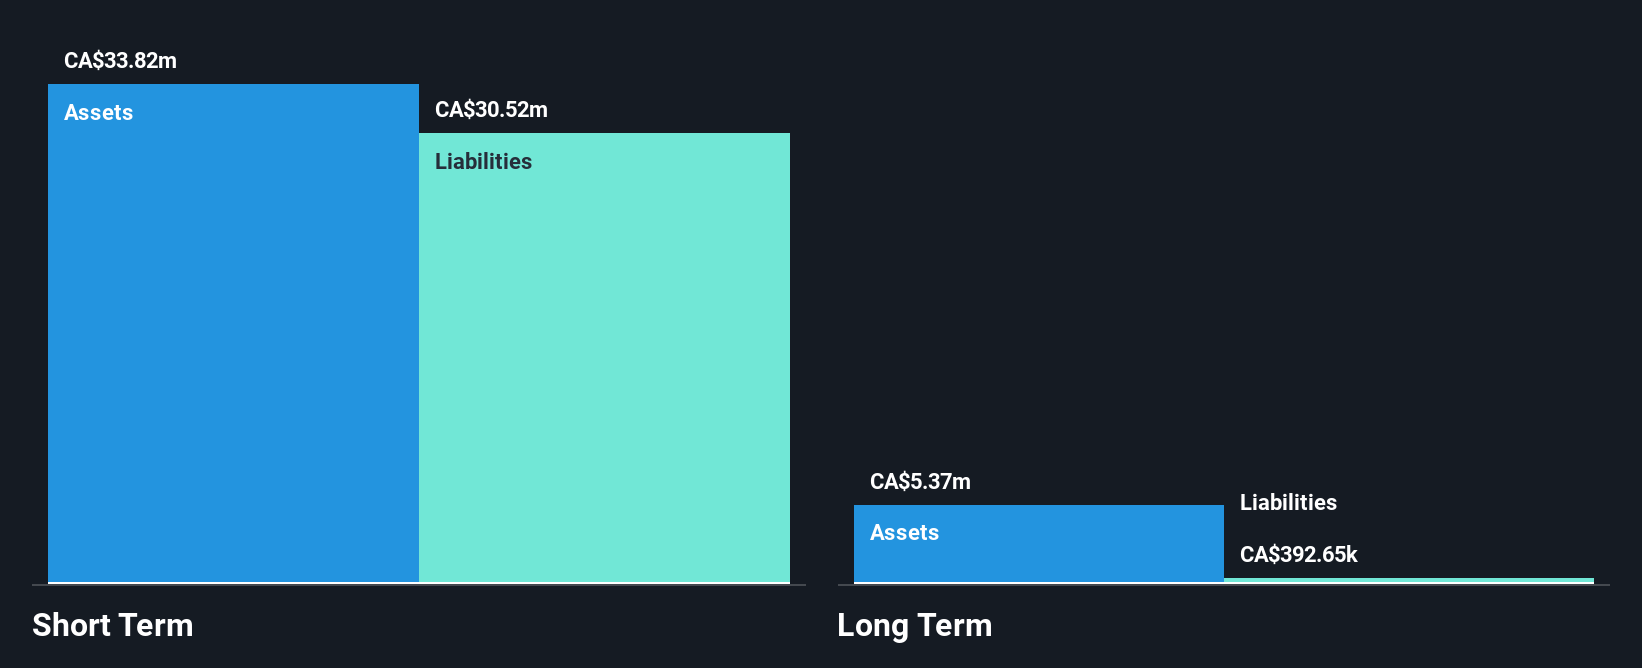
Market Cap: CA$28.45M
NexgenRx Inc. has shown progress by achieving profitability, supported by a revenue increase to CA$4.62 million in the latest quarter compared to CA$4.07 million the previous year. The company benefits from an experienced board and management team, with no debt burden enhancing its financial stability. Short-term assets of CA$33.8 million comfortably cover both short-term and long-term liabilities, reflecting solid liquidity management. Despite a low return on equity at 17.4%, NexgenRx's dividend announcements suggest a focus on shareholder returns, although its dividend track record remains unstable due to recent affirmations of a semi-annual payout of CAD 0.005 per share.
- Get an in-depth perspective on NexgenRx's performance by reading our balance sheet health report here.
- Learn about NexgenRx's historical performance here.
Omni-Lite Industries Canada (TSXV:OML)
Simply Wall St Financial Health Rating: ★★★★★★
Overview: Omni-Lite Industries Canada Inc. is a company that manufactures and sells metal alloys, composite components, and fastener systems in the United States and Canada, with a market cap of CA$26.78 million.
Operations: The company's revenue is primarily generated from the United States at $10.20 million and Canada at $4.10 million.
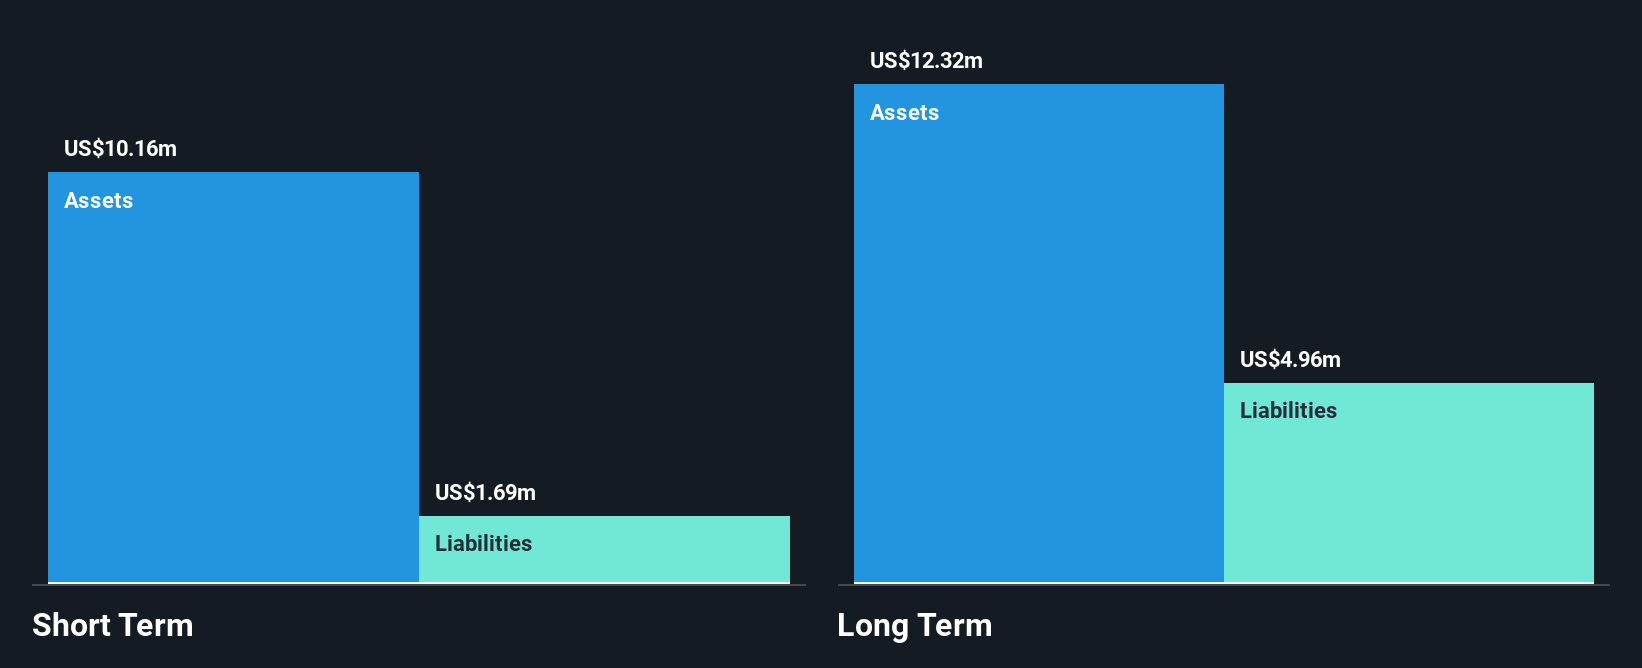
Market Cap: CA$26.78M
Omni-Lite Industries Canada Inc. navigates the penny stock landscape with a market cap of CA$26.78 million, focusing on metal alloys and fastener systems. Despite being unprofitable, the company has reduced its losses by 37.8% annually over five years and maintains a healthy cash runway exceeding three years due to positive free cash flow growth of 43.6% annually. Recent earnings show sales of US$4.04 million for Q3 2025, up from US$3.78 million year-over-year, though net losses persist at US$0.002659 million compared to larger previous losses, indicating gradual financial improvement amidst volatility stability.
- Jump into the full analysis health report here for a deeper understanding of Omni-Lite Industries Canada.
- Review our historical performance report to gain insights into Omni-Lite Industries Canada's track record.
Key Takeaways
- Gain an insight into the universe of 388 TSX Penny Stocks by clicking here.
- Searching for a Fresh Perspective? This technology could replace computers: discover the 29 stocks are working to make quantum computing a reality.
This article by Simply Wall St is general in nature. We provide commentary based on historical data and analyst forecasts only using an unbiased methodology and our articles are not intended to be financial advice. It does not constitute a recommendation to buy or sell any stock, and does not take account of your objectives, or your financial situation. We aim to bring you long-term focused analysis driven by fundamental data. Note that our analysis may not factor in the latest price-sensitive company announcements or qualitative material. Simply Wall St has no position in any stocks mentioned.
Have feedback on this article? Concerned about the content? Get in touch with us directly. Alternatively, email editorial-team@simplywallst.com