
 Nasdaq
 华尔街日报
华尔街日报The Bombay Burmah Trading Corporation Limited's (NSE:BBTC) market cap dropped ₹4.6b last week; Private companies bore the brunt
Key Insights
- The considerable ownership by private companies in Bombay Burmah Trading indicates that they collectively have a greater say in management and business strategy
- 52% of the business is held by the top 2 shareholders
- Insider ownership in Bombay Burmah Trading is 10%
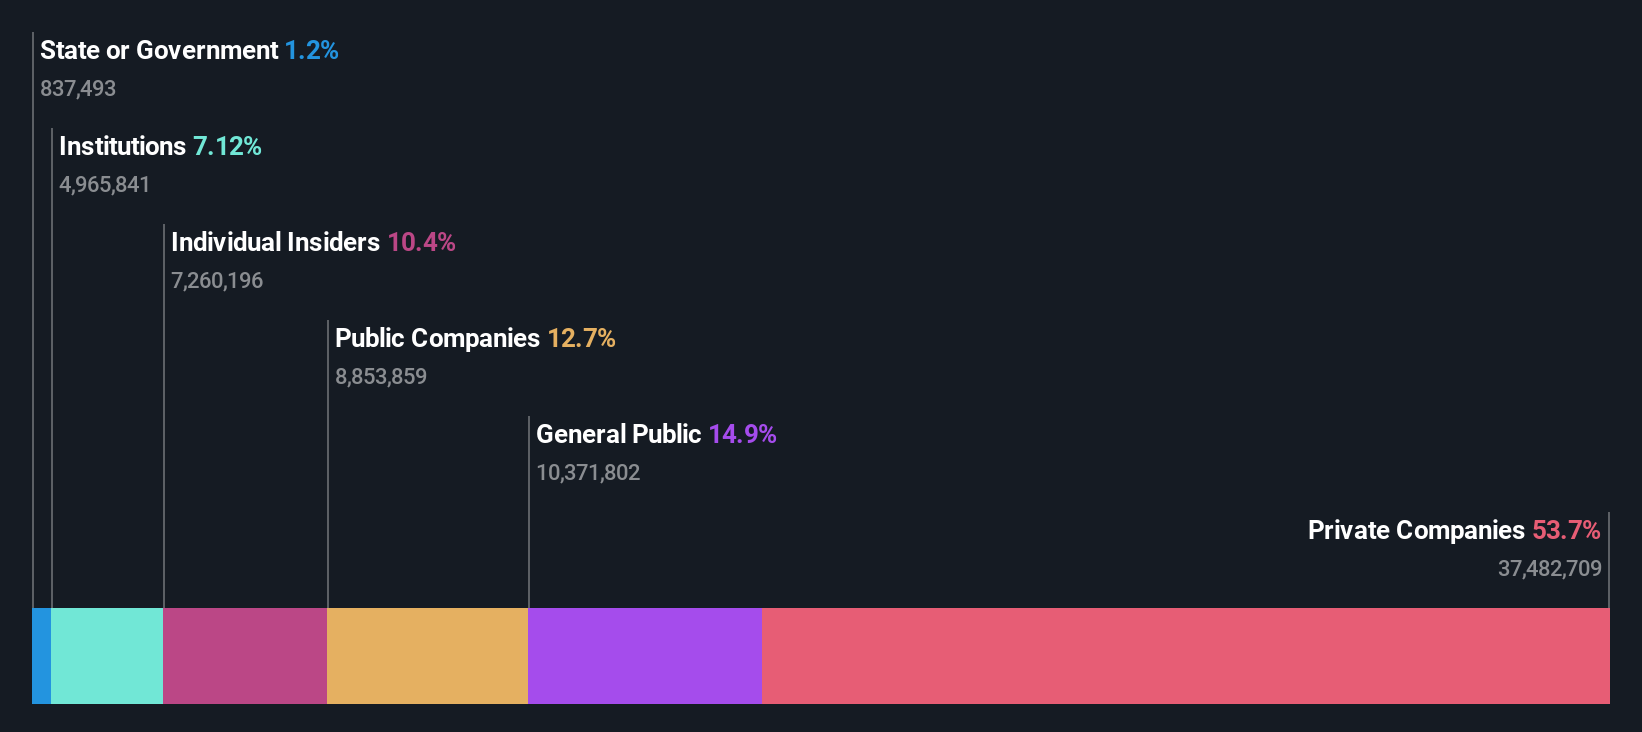
Every investor in The Bombay Burmah Trading Corporation Limited (NSE:BBTC) should be aware of the most powerful shareholder groups. The group holding the most number of shares in the company, around 54% to be precise, is private companies. That is, the group stands to benefit the most if the stock rises (or lose the most if there is a downturn).
As a result, private companies as a group endured the highest losses last week after market cap fell by ₹4.6b.
In the chart below, we zoom in on the different ownership groups of Bombay Burmah Trading.
See our latest analysis for Bombay Burmah Trading
What Does The Institutional Ownership Tell Us About Bombay Burmah Trading?
Institutions typically measure themselves against a benchmark when reporting to their own investors, so they often become more enthusiastic about a stock once it's included in a major index. We would expect most companies to have some institutions on the register, especially if they are growing.
We can see that Bombay Burmah Trading does have institutional investors; and they hold a good portion of the company's stock. This suggests some credibility amongst professional investors. But we can't rely on that fact alone since institutions make bad investments sometimes, just like everyone does. It is not uncommon to see a big share price drop if two large institutional investors try to sell out of a stock at the same time. So it is worth checking the past earnings trajectory of Bombay Burmah Trading, (below). Of course, keep in mind that there are other factors to consider, too.

Hedge funds don't have many shares in Bombay Burmah Trading. The company's largest shareholder is Nowrosjee Wadia & Sons Limited, with ownership of 42%. Nusli Wadia is the second largest shareholder owning 10% of common stock, and Naperol Investments Limited holds about 9.4% of the company stock.
A more detailed study of the shareholder registry showed us that 2 of the top shareholders have a considerable amount of ownership in the company, via their 52% stake.
Researching institutional ownership is a good way to gauge and filter a stock's expected performance. The same can be achieved by studying analyst sentiments. We're not picking up on any analyst coverage of the stock at the moment, so the company is unlikely to be widely held.
Insider Ownership Of Bombay Burmah Trading
The definition of company insiders can be subjective and does vary between jurisdictions. Our data reflects individual insiders, capturing board members at the very least. The company management answer to the board and the latter should represent the interests of shareholders. Notably, sometimes top-level managers are on the board themselves.
Most consider insider ownership a positive because it can indicate the board is well aligned with other shareholders. However, on some occasions too much power is concentrated within this group.
Our information suggests that insiders maintain a significant holding in The Bombay Burmah Trading Corporation Limited. It is very interesting to see that insiders have a meaningful ₹13b stake in this ₹128b business. Most would be pleased to see the board is investing alongside them. You may wish to access this free chart showing recent trading by insiders.
General Public Ownership
The general public, who are usually individual investors, hold a 15% stake in Bombay Burmah Trading. While this group can't necessarily call the shots, it can certainly have a real influence on how the company is run.
Private Company Ownership
We can see that Private Companies own 54%, of the shares on issue. It's hard to draw any conclusions from this fact alone, so its worth looking into who owns those private companies. Sometimes insiders or other related parties have an interest in shares in a public company through a separate private company.
Public Company Ownership
It appears to us that public companies own 13% of Bombay Burmah Trading. It's hard to say for sure but this suggests they have entwined business interests. This might be a strategic stake, so it's worth watching this space for changes in ownership.
Next Steps:
While it is well worth considering the different groups that own a company, there are other factors that are even more important.
Many find it useful to take an in depth look at how a company has performed in the past. You can access this detailed graph of past earnings, revenue and cash flow.
Of course this may not be the best stock to buy. So take a peek at this free free list of interesting companies.
NB: Figures in this article are calculated using data from the last twelve months, which refer to the 12-month period ending on the last date of the month the financial statement is dated. This may not be consistent with full year annual report figures.
Have feedback on this article? Concerned about the content? Get in touch with us directly. Alternatively, email editorial-team (at) simplywallst.com.
This article by Simply Wall St is general in nature. We provide commentary based on historical data and analyst forecasts only using an unbiased methodology and our articles are not intended to be financial advice. It does not constitute a recommendation to buy or sell any stock, and does not take account of your objectives, or your financial situation. We aim to bring you long-term focused analysis driven by fundamental data. Note that our analysis may not factor in the latest price-sensitive company announcements or qualitative material. Simply Wall St has no position in any stocks mentioned.