
 Nasdaq
 华尔街日报
华尔街日报With 81% ownership, SSE plc (LON:SSE) boasts of strong institutional backing
Key Insights
- Institutions' substantial holdings in SSE implies that they have significant influence over the company's share price
- A total of 23 investors have a majority stake in the company with 51% ownership
- Using data from analyst forecasts alongside ownership research, one can better assess the future performance of a company
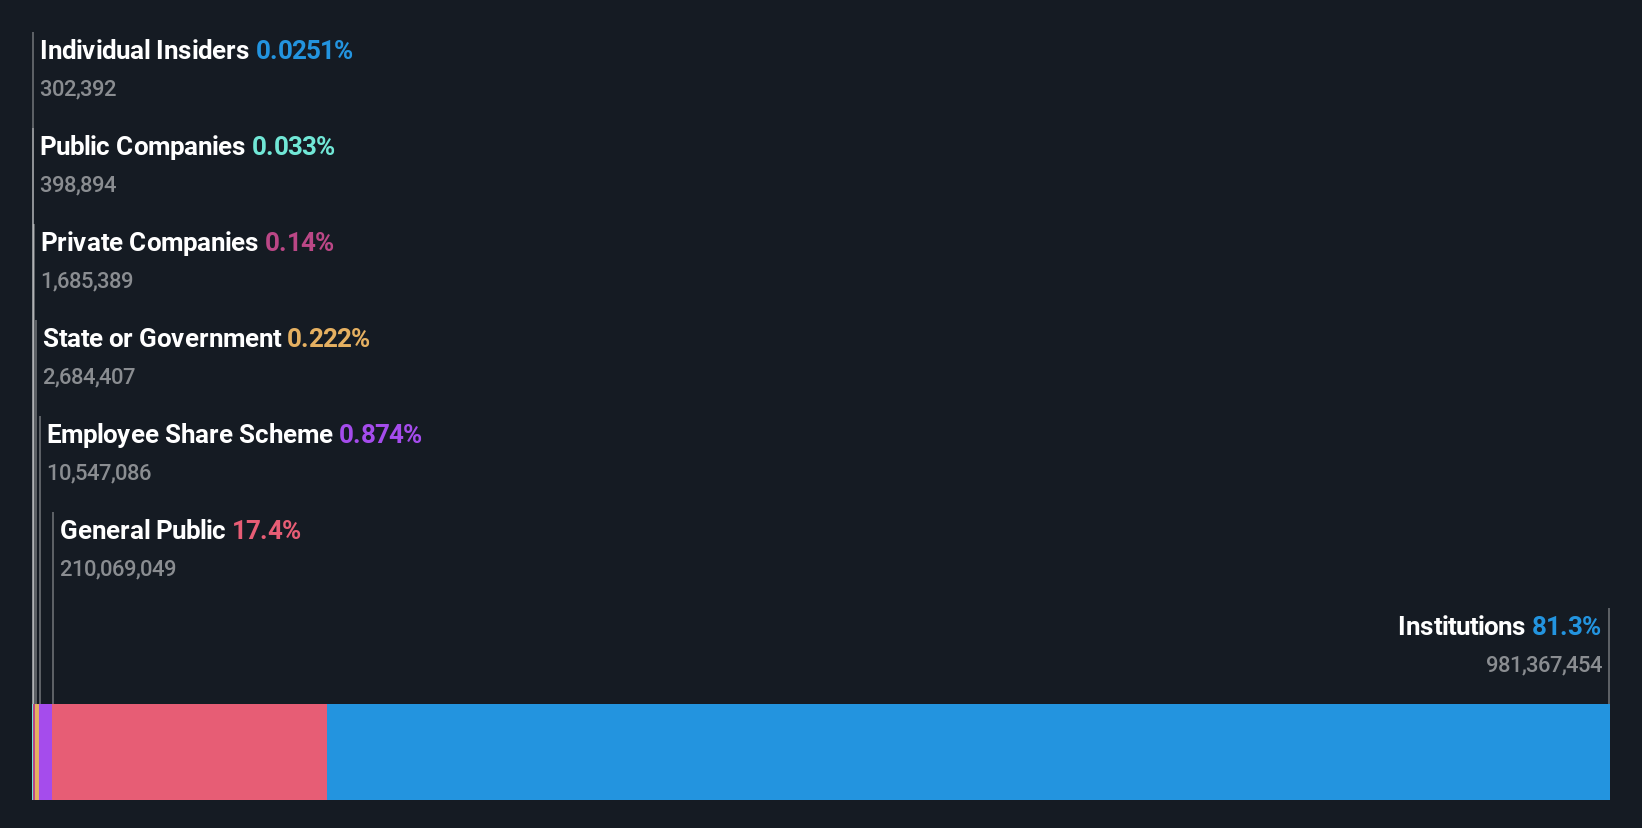
If you want to know who really controls SSE plc (LON:SSE), then you'll have to look at the makeup of its share registry. The group holding the most number of shares in the company, around 81% to be precise, is institutions. Put another way, the group faces the maximum upside potential (or downside risk).
Because institutional owners have a huge pool of resources and liquidity, their investing decisions tend to carry a great deal of weight, especially with individual investors. Therefore, a good portion of institutional money invested in the company is usually a huge vote of confidence on its future.
Let's delve deeper into each type of owner of SSE, beginning with the chart below.
View our latest analysis for SSE
What Does The Institutional Ownership Tell Us About SSE?
Institutional investors commonly compare their own returns to the returns of a commonly followed index. So they generally do consider buying larger companies that are included in the relevant benchmark index.
SSE already has institutions on the share registry. Indeed, they own a respectable stake in the company. This suggests some credibility amongst professional investors. But we can't rely on that fact alone since institutions make bad investments sometimes, just like everyone does. It is not uncommon to see a big share price drop if two large institutional investors try to sell out of a stock at the same time. So it is worth checking the past earnings trajectory of SSE, (below). Of course, keep in mind that there are other factors to consider, too.

Institutional investors own over 50% of the company, so together than can probably strongly influence board decisions. Hedge funds don't have many shares in SSE. BlackRock, Inc. is currently the company's largest shareholder with 7.0% of shares outstanding. With 5.4% and 5.1% of the shares outstanding respectively, JPMorgan Chase & Co. and The Vanguard Group, Inc. are the second and third largest shareholders.
After doing some more digging, we found that the top 23 have the combined ownership of 51% in the company, suggesting that no single shareholder has significant control over the company.
Researching institutional ownership is a good way to gauge and filter a stock's expected performance. The same can be achieved by studying analyst sentiments. There are plenty of analysts covering the stock, so it might be worth seeing what they are forecasting, too.
Insider Ownership Of SSE
The definition of company insiders can be subjective and does vary between jurisdictions. Our data reflects individual insiders, capturing board members at the very least. Company management run the business, but the CEO will answer to the board, even if he or she is a member of it.
Insider ownership is positive when it signals leadership are thinking like the true owners of the company. However, high insider ownership can also give immense power to a small group within the company. This can be negative in some circumstances.
Our most recent data indicates that insiders own less than 1% of SSE plc. It is a very large company, so it would be surprising to see insiders own a large proportion of the company. Though their holding amounts to less than 1%, we can see that board members collectively own UK£6.5m worth of shares (at current prices). Arguably recent buying and selling is just as important to consider. You can click here to see if insiders have been buying or selling.
General Public Ownership
The general public-- including retail investors -- own 17% stake in the company, and hence can't easily be ignored. While this size of ownership may not be enough to sway a policy decision in their favour, they can still make a collective impact on company policies.
Next Steps:
While it is well worth considering the different groups that own a company, there are other factors that are even more important. Consider risks, for instance. Every company has them, and we've spotted 3 warning signs for SSE you should know about.
But ultimately it is the future, not the past, that will determine how well the owners of this business will do. Therefore we think it advisable to take a look at this free report showing whether analysts are predicting a brighter future.
NB: Figures in this article are calculated using data from the last twelve months, which refer to the 12-month period ending on the last date of the month the financial statement is dated. This may not be consistent with full year annual report figures.
Have feedback on this article? Concerned about the content? Get in touch with us directly. Alternatively, email editorial-team (at) simplywallst.com.
This article by Simply Wall St is general in nature. We provide commentary based on historical data and analyst forecasts only using an unbiased methodology and our articles are not intended to be financial advice. It does not constitute a recommendation to buy or sell any stock, and does not take account of your objectives, or your financial situation. We aim to bring you long-term focused analysis driven by fundamental data. Note that our analysis may not factor in the latest price-sensitive company announcements or qualitative material. Simply Wall St has no position in any stocks mentioned.