
 Nasdaq
 华尔街日报
华尔街日报Estimating The Intrinsic Value Of CEAT Limited (NSE:CEATLTD)
Key Insights
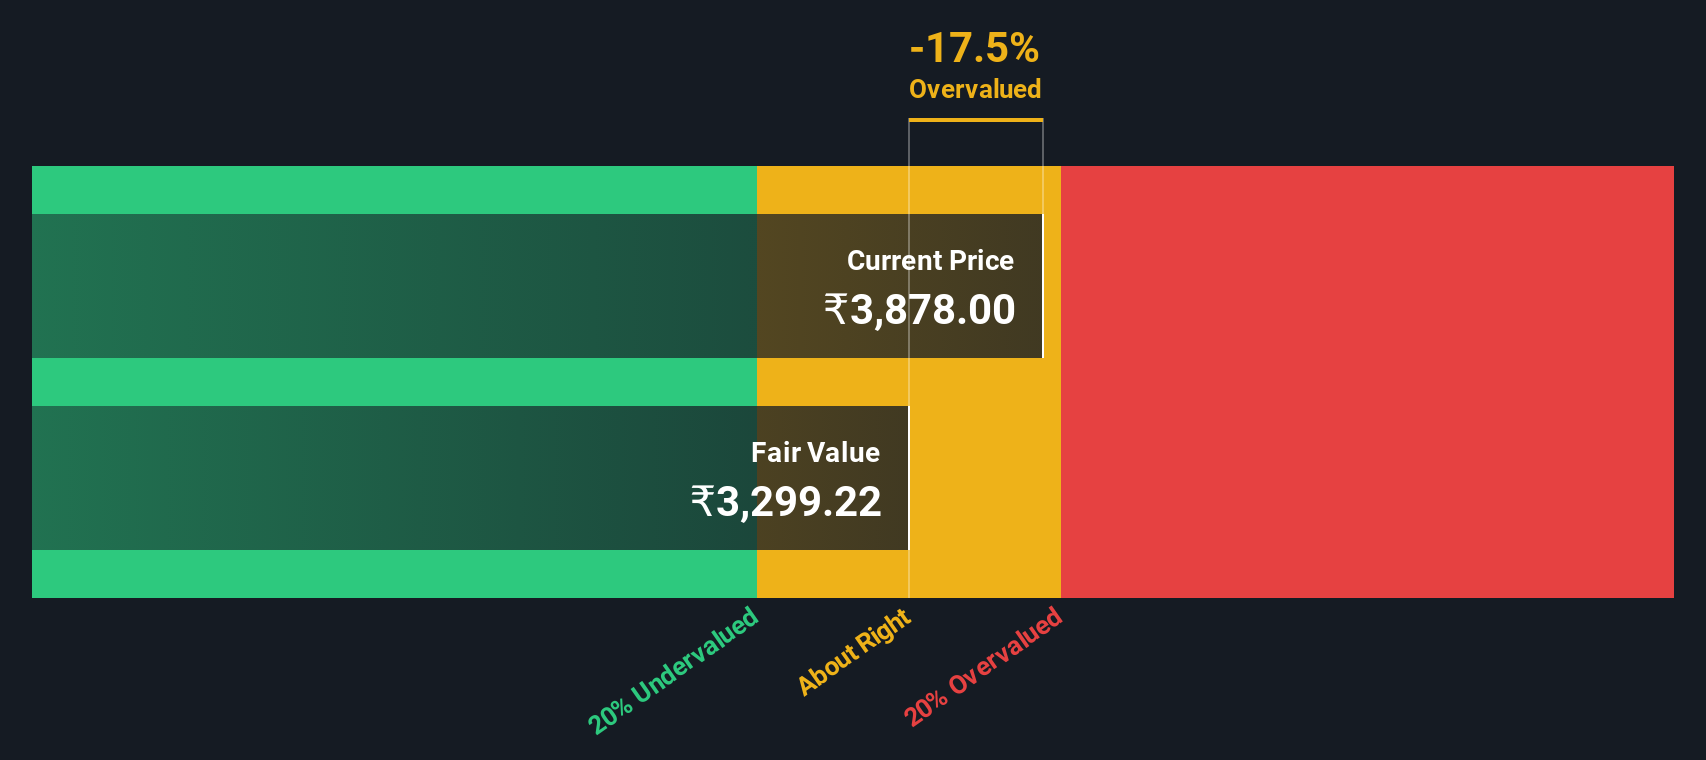
- Using the 2 Stage Free Cash Flow to Equity, CEAT fair value estimate is ₹3,299
- Current share price of ₹3,878 suggests CEAT is potentially trading close to its fair value
- Analyst price target for CEATLTD is ₹4,216, which is 28% above our fair value estimate
In this article we are going to estimate the intrinsic value of CEAT Limited (NSE:CEATLTD) by taking the expected future cash flows and discounting them to their present value. Our analysis will employ the Discounted Cash Flow (DCF) model. Believe it or not, it's not too difficult to follow, as you'll see from our example!
We would caution that there are many ways of valuing a company and, like the DCF, each technique has advantages and disadvantages in certain scenarios. For those who are keen learners of equity analysis, the Simply Wall St analysis model here may be something of interest to you.
Crunching The Numbers
We use what is known as a 2-stage model, which simply means we have two different periods of growth rates for the company's cash flows. Generally the first stage is higher growth, and the second stage is a lower growth phase. To begin with, we have to get estimates of the next ten years of cash flows. Where possible we use analyst estimates, but when these aren't available we extrapolate the previous free cash flow (FCF) from the last estimate or reported value. We assume companies with shrinking free cash flow will slow their rate of shrinkage, and that companies with growing free cash flow will see their growth rate slow, over this period. We do this to reflect that growth tends to slow more in the early years than it does in later years.
A DCF is all about the idea that a dollar in the future is less valuable than a dollar today, so we need to discount the sum of these future cash flows to arrive at a present value estimate:
10-year free cash flow (FCF) estimate
| 2026 | 2027 | 2028 | 2029 | 2030 | 2031 | 2032 | 2033 | 2034 | 2035 | |
| Levered FCF (₹, Millions) | -₹3.44b | ₹7.93b | ₹9.33b | ₹12.3b | ₹14.7b | ₹17.1b | ₹19.3b | ₹21.5b | ₹23.6b | ₹25.7b |
| Growth Rate Estimate Source | Analyst x14 | Analyst x13 | Analyst x13 | Analyst x1 | Est @ 19.72% | Est @ 15.84% | Est @ 13.13% | Est @ 11.23% | Est @ 9.89% | Est @ 8.96% |
| Present Value (₹, Millions) Discounted @ 15% | -₹3.0k | ₹6.0k | ₹6.1k | ₹6.9k | ₹7.2k | ₹7.2k | ₹7.1k | ₹6.8k | ₹6.5k | ₹6.1k |
("Est" = FCF growth rate estimated by Simply Wall St)
Present Value of 10-year Cash Flow (PVCF) = ₹57b
We now need to calculate the Terminal Value, which accounts for all the future cash flows after this ten year period. For a number of reasons a very conservative growth rate is used that cannot exceed that of a country's GDP growth. In this case we have used the 5-year average of the 10-year government bond yield (6.8%) to estimate future growth. In the same way as with the 10-year 'growth' period, we discount future cash flows to today's value, using a cost of equity of 15%.
Terminal Value (TV)= FCF2035 × (1 + g) ÷ (r – g) = ₹26b× (1 + 6.8%) ÷ (15%– 6.8%) = ₹320b
Present Value of Terminal Value (PVTV)= TV / (1 + r)10= ₹320b÷ ( 1 + 15%)10= ₹76b
The total value, or equity value, is then the sum of the present value of the future cash flows, which in this case is ₹133b. In the final step we divide the equity value by the number of shares outstanding. Compared to the current share price of ₹3.9k, the company appears around fair value at the time of writing. Remember though, that this is just an approximate valuation, and like any complex formula - garbage in, garbage out.
The Assumptions
Now the most important inputs to a discounted cash flow are the discount rate, and of course, the actual cash flows. You don't have to agree with these inputs, I recommend redoing the calculations yourself and playing with them. The DCF also does not consider the possible cyclicality of an industry, or a company's future capital requirements, so it does not give a full picture of a company's potential performance. Given that we are looking at CEAT as potential shareholders, the cost of equity is used as the discount rate, rather than the cost of capital (or weighted average cost of capital, WACC) which accounts for debt. In this calculation we've used 15%, which is based on a levered beta of 1.151. Beta is a measure of a stock's volatility, compared to the market as a whole. We get our beta from the industry average beta of globally comparable companies, with an imposed limit between 0.8 and 2.0, which is a reasonable range for a stable business.
View our latest analysis for CEAT
SWOT Analysis for CEAT
- Debt is well covered by earnings and cashflows.
- Dividends are covered by earnings and cash flows.
- Earnings declined over the past year.
- Dividend is low compared to the top 25% of dividend payers in the Auto Components market.
- Annual earnings are forecast to grow faster than the Indian market.
- Good value based on P/E ratio compared to estimated Fair P/E ratio.
- Annual revenue is forecast to grow slower than the Indian market.
Moving On:
Whilst important, the DCF calculation ideally won't be the sole piece of analysis you scrutinize for a company. It's not possible to obtain a foolproof valuation with a DCF model. Rather it should be seen as a guide to "what assumptions need to be true for this stock to be under/overvalued?" For example, changes in the company's cost of equity or the risk free rate can significantly impact the valuation. For CEAT, we've put together three essential factors you should consider:
- Risks: We feel that you should assess the 2 warning signs for CEAT we've flagged before making an investment in the company.
- Future Earnings: How does CEATLTD's growth rate compare to its peers and the wider market? Dig deeper into the analyst consensus number for the upcoming years by interacting with our free analyst growth expectation chart.
- Other High Quality Alternatives: Do you like a good all-rounder? Explore our interactive list of high quality stocks to get an idea of what else is out there you may be missing!
PS. Simply Wall St updates its DCF calculation for every Indian stock every day, so if you want to find the intrinsic value of any other stock just search here.
Have feedback on this article? Concerned about the content? Get in touch with us directly. Alternatively, email editorial-team (at) simplywallst.com.
This article by Simply Wall St is general in nature. We provide commentary based on historical data and analyst forecasts only using an unbiased methodology and our articles are not intended to be financial advice. It does not constitute a recommendation to buy or sell any stock, and does not take account of your objectives, or your financial situation. We aim to bring you long-term focused analysis driven by fundamental data. Note that our analysis may not factor in the latest price-sensitive company announcements or qualitative material. Simply Wall St has no position in any stocks mentioned.