
 Nasdaq
 华尔街日报
华尔街日报Does Constellation Energy’s 330% Three Year Surge Still Align With Its Fundamentals in 2025?
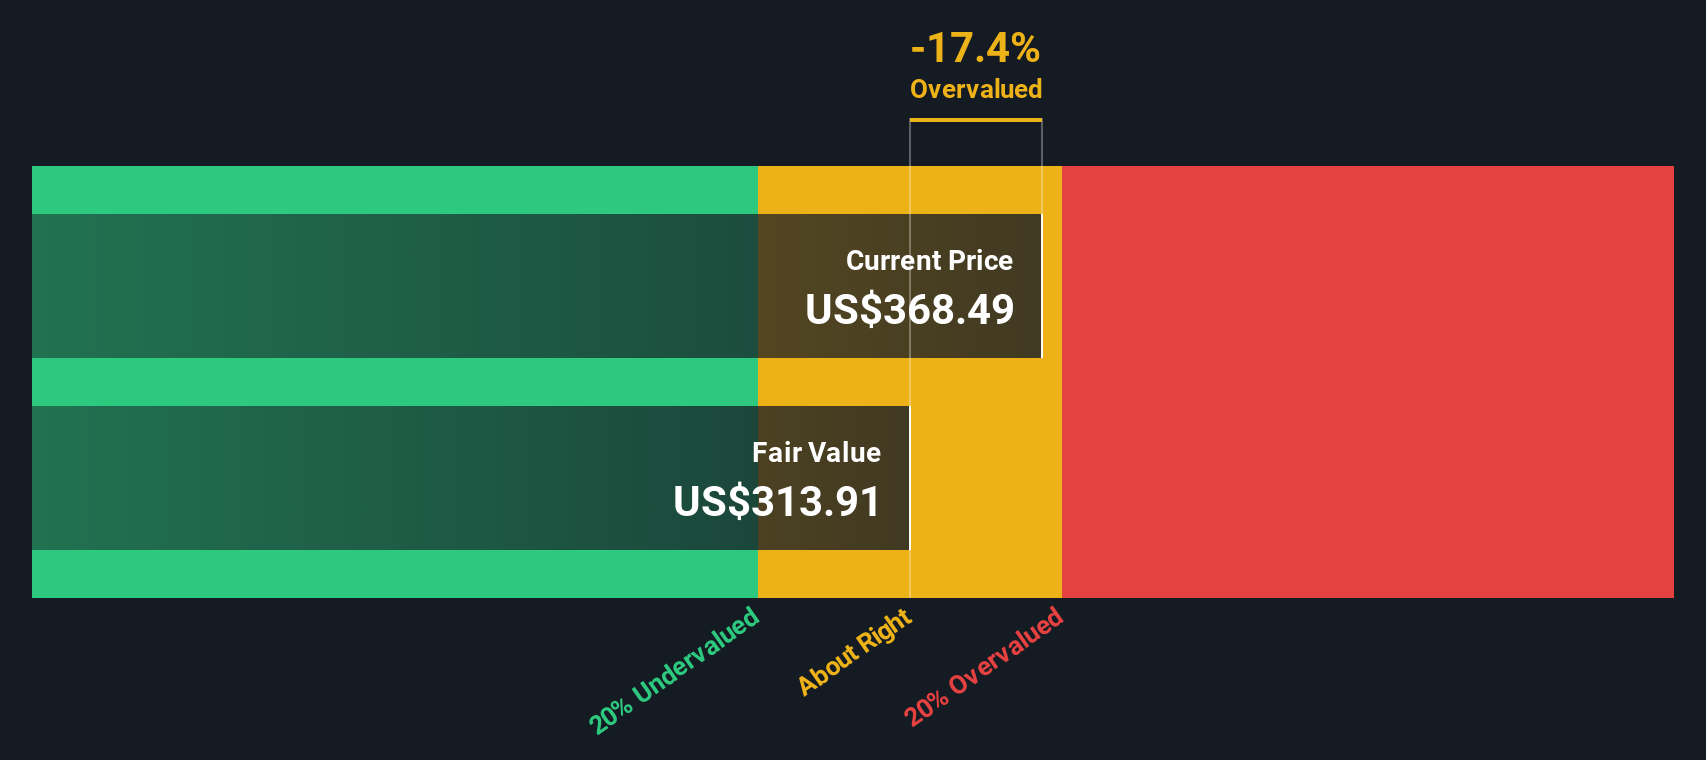
- Wondering if Constellation Energy at around $363 a share is still a smart buy after its massive run, or if you are turning up late to the party? This article examines whether the current price still stacks up against the company fundamentals.
- The stock has climbed about 6.7% over the last week and 2.8% over the past month, with an eye catching 50.0% year to date and 59.3% over the last year, on top of a 330.7% gain over three years.
- Recently, investors have been focused on Constellation Energy's role as a major nuclear and clean power player in the United States, especially as policy and corporate demand tilt toward low carbon generation. At the same time, the broader conversation about grid reliability and data center power needs has drawn extra attention to companies like Constellation that can provide large scale, around the clock electricity.
- Despite that enthusiasm, Constellation Energy only scores a 2 out of 6 on our valuation checks, suggesting that on traditional metrics it looks fully priced in some areas and potentially attractive in others. Next we will break down those valuation approaches, then later return to a more complete way of thinking about value that goes beyond the usual ratios.
Constellation Energy scores just 2/6 on our valuation checks. See what other red flags we found in the full valuation breakdown.
Approach 1: Constellation Energy Discounted Cash Flow (DCF) Analysis
A Discounted Cash Flow model estimates what a company is worth today by projecting its future cash flows and discounting them back to the present. For Constellation Energy, the model used is a 2 Stage Free Cash Flow to Equity approach, based on cash flow projections in $.
The latest twelve month free cash flow is around negative $657.2 Million, reflecting heavy investment and near term cash outflows. However, analysts and extrapolated estimates see this turning into strong positive cash generation, with free cash flow expected to reach about $5.7 Billion by 2029 and continuing to grow thereafter. Simply Wall St discounts these projected cash flows back to today, including estimates out to 2035, to arrive at an intrinsic value per share.
On this basis, the DCF model suggests a fair value of about $489.59 per share, implying Constellation Energy is roughly 25.7% undervalued compared with the current share price around $363. In other words, the market may not yet be fully pricing in the scale of future cash generation.
Result: UNDERVALUED
Our Discounted Cash Flow (DCF) analysis suggests Constellation Energy is undervalued by 25.7%. Track this in your watchlist or portfolio, or discover 901 more undervalued stocks based on cash flows.
Approach 2: Constellation Energy Price vs Earnings
For profitable companies like Constellation Energy, the price to earnings ratio is a useful yardstick because it links what investors pay today to the profits the business is already generating. In general, companies with stronger, more reliable growth and lower perceived risk can justify a higher, normal PE ratio, while slower growing or riskier firms typically trade on lower multiples.
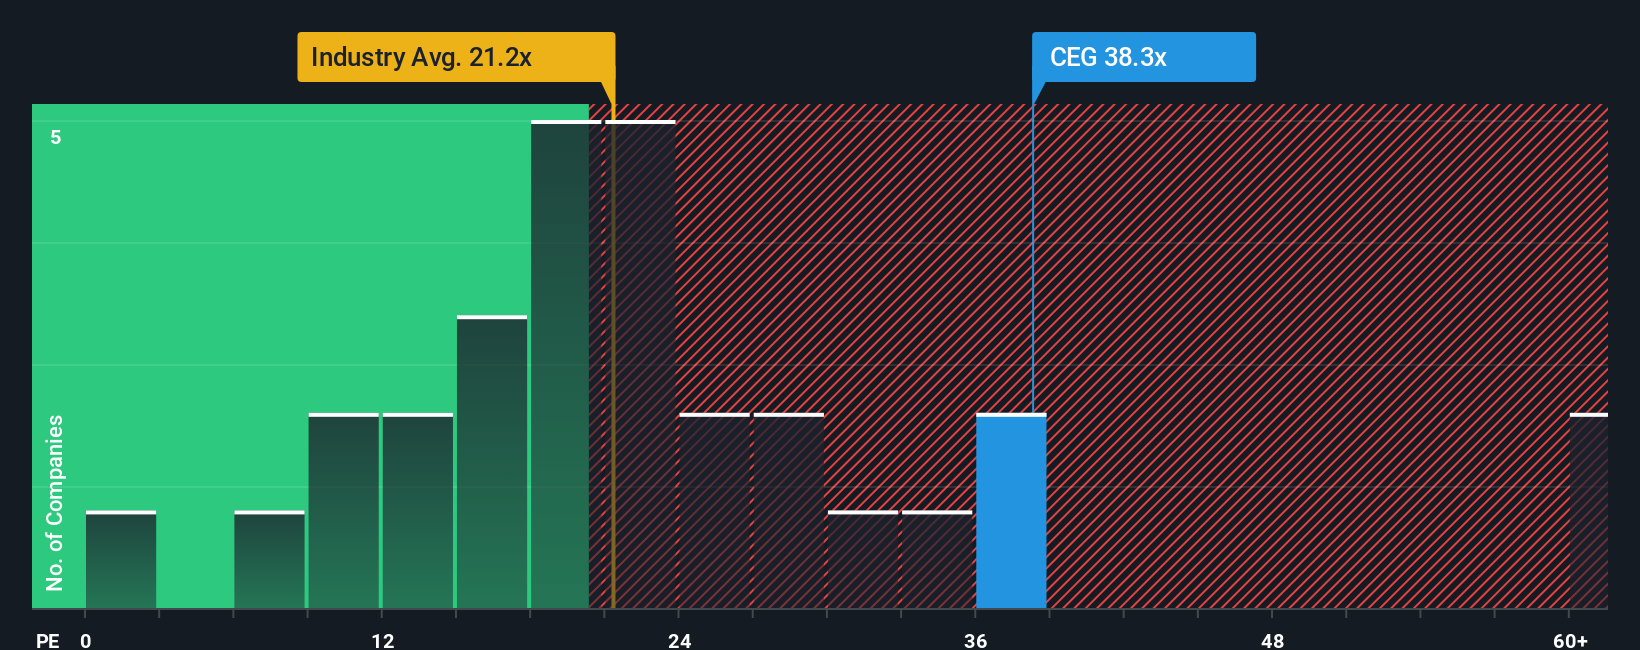
Constellation currently trades on about 41.5x earnings, which is more than double the electric utilities industry average of roughly 19.6x and also above the peer group average of around 20.7x. On the surface, that premium suggests the market is already baking in a lot of optimism about future earnings growth and the value of its nuclear and clean power portfolio.
Simply Wall St goes a step further with its Fair Ratio, a proprietary estimate of what PE you might expect given the company’s earnings growth outlook, profitability, industry, market cap and risk profile. For Constellation, this Fair Ratio is about 39.6x, which is slightly below the current market multiple. That points to the shares trading a bit ahead of what those fundamentals alone would justify.
Result: OVERVALUED
PE ratios tell one story, but what if the real opportunity lies elsewhere? Discover 1459 companies where insiders are betting big on explosive growth.
Upgrade Your Decision Making: Choose your Constellation Energy Narrative
Earlier we mentioned that there is an even better way to understand valuation, so let us introduce you to Narratives, a simple tool on Simply Wall St’s Community page. It lets you describe your story for Constellation Energy in plain language, link it to specific assumptions about future revenue, earnings and margins, and instantly translate that story into a full forecast, a Fair Value, and a clear valuation view by comparing that Fair Value with today’s share price. All of this then updates dynamically as new news or earnings arrive. You can see, for example, how one investor might build a bullish Constellation Energy Narrative around data center driven power demand, rising nuclear cash flows and a Fair Value near $400 per share, while another takes a more cautious view that emphasizes regulatory and concentration risks and lands closer to $185, yet both are using the same framework to decide whether the current price leaves enough upside for their next move.
Do you think there's more to the story for Constellation Energy? Head over to our Community to see what others are saying!

This article by Simply Wall St is general in nature. We provide commentary based on historical data and analyst forecasts only using an unbiased methodology and our articles are not intended to be financial advice. It does not constitute a recommendation to buy or sell any stock, and does not take account of your objectives, or your financial situation. We aim to bring you long-term focused analysis driven by fundamental data. Note that our analysis may not factor in the latest price-sensitive company announcements or qualitative material. Simply Wall St has no position in any stocks mentioned.
Have feedback on this article? Concerned about the content? Get in touch with us directly. Alternatively, email editorial-team@simplywallst.com