
 Nasdaq
 华尔街日报
华尔街日报Assessing ASML Holding After a 52% Rally and DCF Signals Caution
- If you are wondering whether ASML Holding is still worth buying after such a huge run, you are not alone. This stock sits right at the center of the semiconductor boom story many investors are trying to price correctly.
- ASML shares have climbed 4.9% over the last week, 7.9% over the past month, and are up a striking 52.1% year to date and 49.2% over the last year, with multi year gains of 105.1% over three years and 126.0% over five years. These moves are changing how the market thinks about its risk and reward profile.
- Recent headlines have focused on ASML's dominant position in extreme ultraviolet lithography tools and its crucial role in enabling next generation chips, reinforcing the idea that chipmakers are heavily dependent on its technology. At the same time, ongoing regulatory scrutiny over advanced equipment shipments to China and shifting chip capex plans globally have added nuance to how investors interpret the stock's latest surge.
- Despite all that excitement, ASML currently scores just 1 out of 6 on our valuation checks. This suggests the market may already be pricing in a lot of its future growth. Next we will break down what different valuation approaches say about ASML, before finishing with a more holistic way to think about what the stock is really worth.
ASML Holding scores just 1/6 on our valuation checks. See what other red flags we found in the full valuation breakdown.
Approach 1: ASML Holding Discounted Cash Flow (DCF) Analysis
A Discounted Cash Flow model estimates what a business is worth by projecting the cash it can generate in the future and then discounting those cash flows back to today. For ASML Holding, this is done using a 2 Stage Free Cash Flow to Equity approach, which assumes a faster growth phase that gradually tapers to a more sustainable rate.
ASML recently generated trailing twelve month free cash flow of about €8.6 billion. Analyst forecasts, extended by Simply Wall St beyond their explicit horizon, point to free cash flow rising to roughly €24.3 billion by 2035, implying strong but moderating growth over the next decade as the company matures. These future cash flows are discounted to reflect risk and the time value of money.
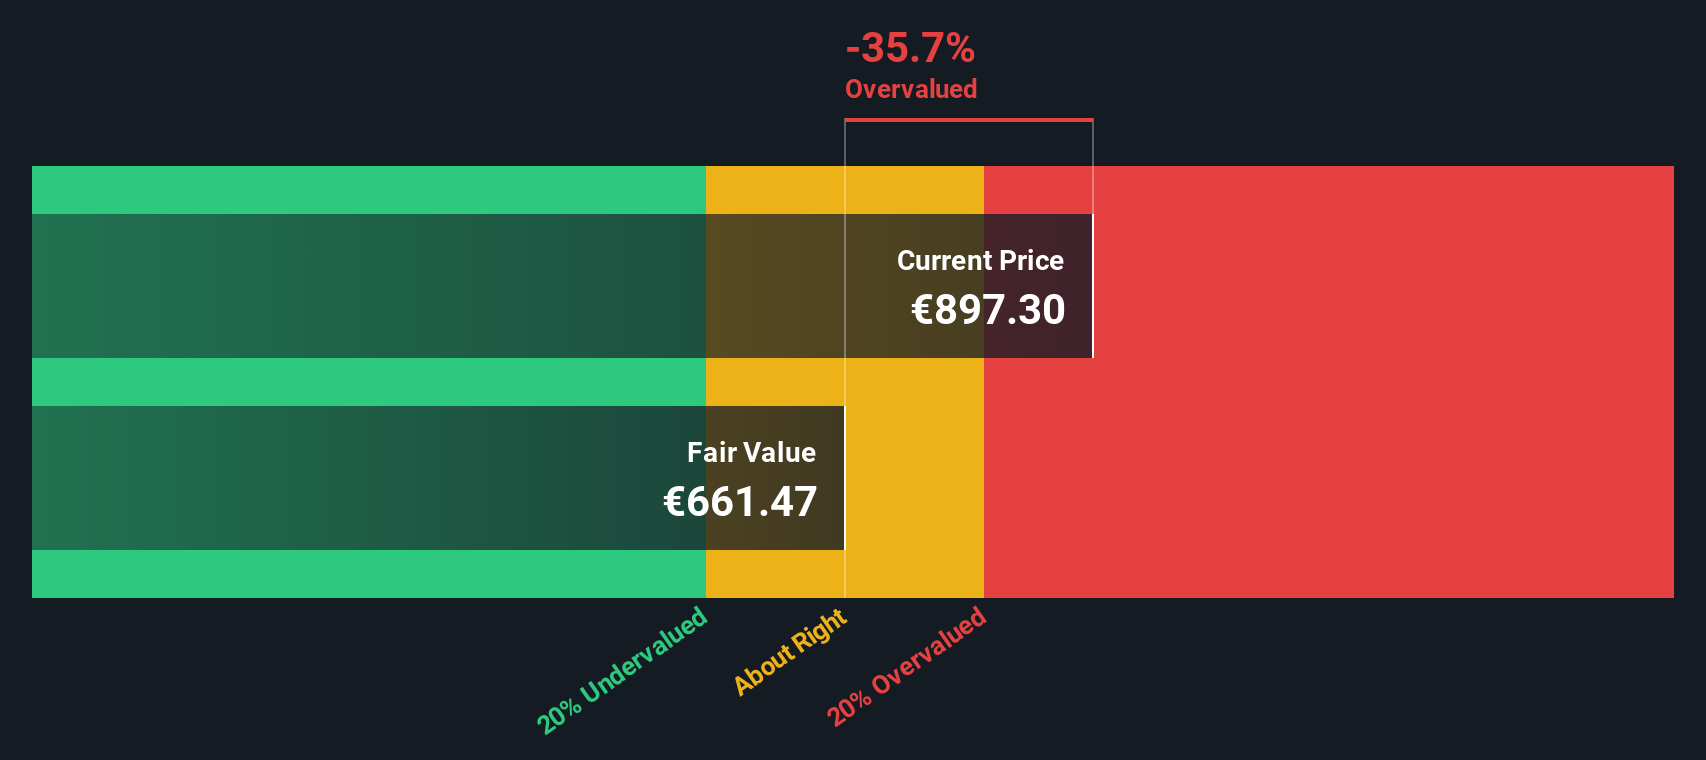
Bringing all those projected cash flows back to today yields an estimated intrinsic value of about $774 per share. Against the current market price, that implies ASML is roughly 37.6% overvalued on this DCF view, suggesting investors are paying a steep premium for its growth story.
Result: OVERVALUED
Our Discounted Cash Flow (DCF) analysis suggests ASML Holding may be overvalued by 37.6%. Discover 901 undervalued stocks or create your own screener to find better value opportunities.
Approach 2: ASML Holding Price vs Earnings
For consistently profitable businesses like ASML, the price to earnings multiple is a practical way to judge valuation, because it ties the share price directly to the company’s current earning power. In general, faster and more reliable earnings growth, alongside lower perceived risk, can justify a higher PE ratio. Slower growth or higher uncertainty should pull that number down.
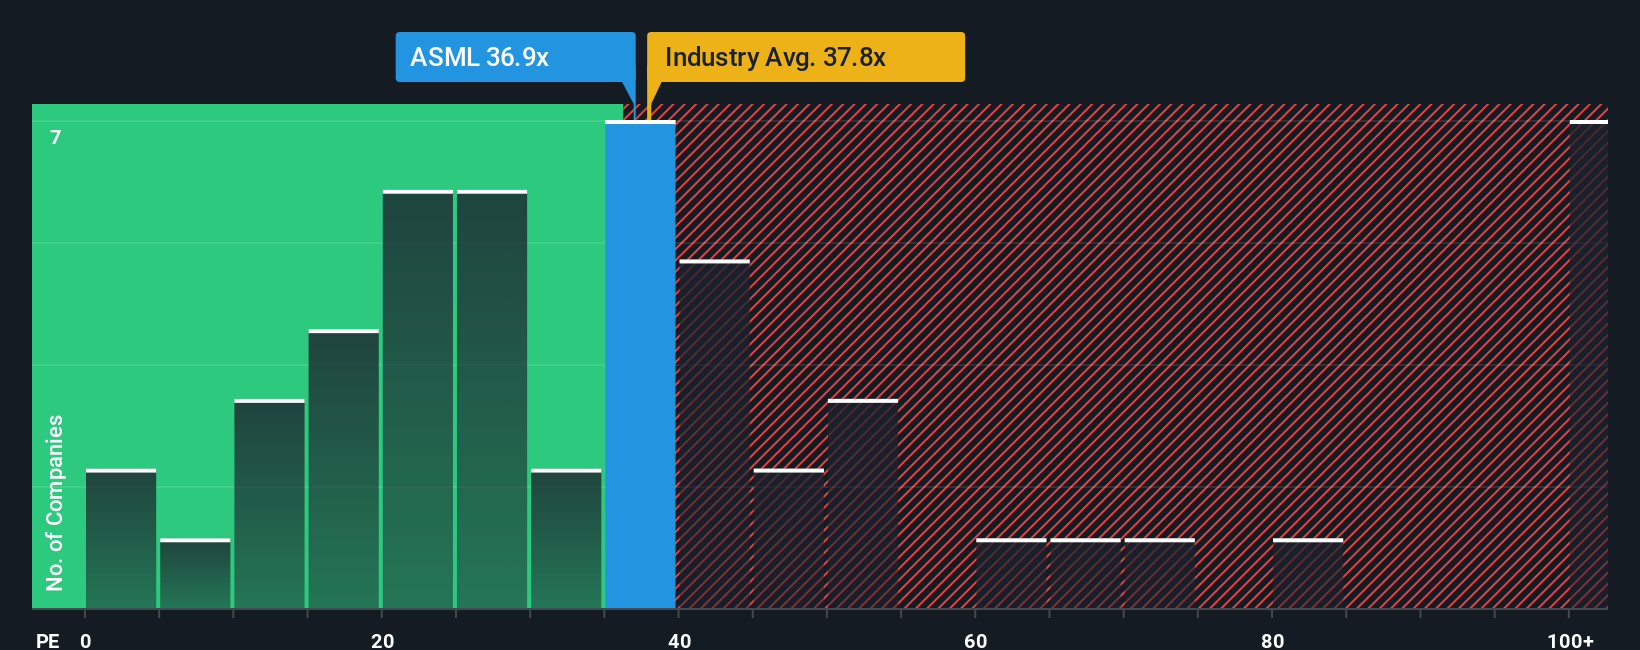
ASML currently trades on a PE of about 36.8x, which is slightly above the broader Semiconductor industry average of roughly 36.5x, but below the 44.4x average of its higher growth peers. Simply Wall St’s proprietary Fair Ratio for ASML is 31.2x, which reflects what investors might reasonably pay given its earnings growth outlook, margins, industry positioning, market cap and specific risks.
Unlike simple peer or industry comparisons, the Fair Ratio adjusts for ASML’s own fundamentals rather than assuming all chip stocks deserve similar multiples. On this lens, ASML’s actual PE of 36.8x sits noticeably above the 31.2x Fair Ratio. This indicates the market is assigning a premium that its fundamentals do not fully support.
Result: OVERVALUED
PE ratios tell one story, but what if the real opportunity lies elsewhere? Discover 1459 companies where insiders are betting big on explosive growth.
Upgrade Your Decision Making: Choose your ASML Holding Narrative
Earlier we mentioned that there is an even better way to understand valuation, so let us introduce you to Narratives, an approach that lets you attach a clear story to the numbers you are using for ASML Holding’s fair value, revenue, earnings and margins. A Narrative is a simple, structured way to capture your perspective on the company, link that story to a financial forecast, and then translate it into a Fair Value that you can easily compare with today’s share price to decide whether to buy, hold or sell. On Simply Wall St, Narratives live in the Community page, where millions of investors can explore and build their own views using an accessible tool that automatically updates when new information, like earnings or major news, comes in. With ASML, for example, one Narrative might set a Fair Value near $1,000 because it expects sustained double digit growth from EUV dominance, while another might anchor closer to $750, assuming growth cools as macro risks and export controls bite.
Do you think there's more to the story for ASML Holding? Head over to our Community to see what others are saying!

This article by Simply Wall St is general in nature. We provide commentary based on historical data and analyst forecasts only using an unbiased methodology and our articles are not intended to be financial advice. It does not constitute a recommendation to buy or sell any stock, and does not take account of your objectives, or your financial situation. We aim to bring you long-term focused analysis driven by fundamental data. Note that our analysis may not factor in the latest price-sensitive company announcements or qualitative material. Simply Wall St has no position in any stocks mentioned.
Have feedback on this article? Concerned about the content? Get in touch with us directly. Alternatively, email editorial-team@simplywallst.com