
 Nasdaq
 华尔街日报
华尔街日报Berkshire Hathaway (BRK.B): Reassessing Valuation After a Recent Share Price Pause
Berkshire Hathaway (BRK.B) has quietly slipped about 1% over the past month, even as its long term track record stays intact. That kind of pause usually tempts patient investors to revisit the valuation.
See our latest analysis for Berkshire Hathaway.
Zooming out, Berkshire’s modest 30 day share price pullback sits against an 11.14% year to date share price return and a powerful 118.31% five year total shareholder return. This suggests long term momentum is very much intact while near term enthusiasm cools.
If Berkshire’s steady compounding appeals to you, this could be a good moment to explore fast growing stocks with high insider ownership, which might offer a more aggressive growth profile alongside committed insider backing.
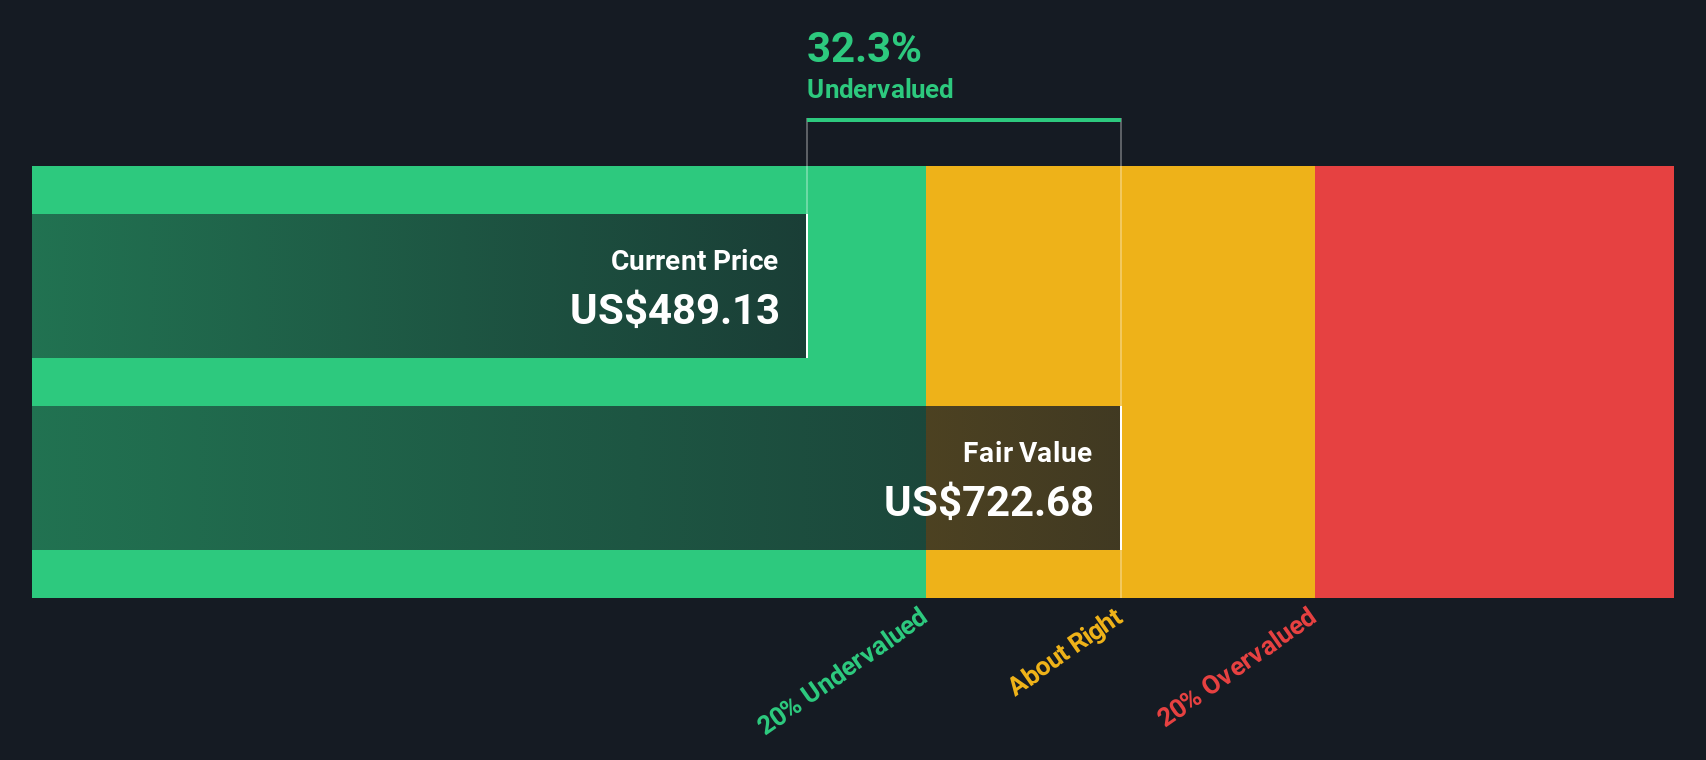
With shares trading only slightly below analyst targets but at a hefty estimated intrinsic discount, the real question is whether Berkshire is quietly undervalued or if the market has already priced in years of future growth.
Price-to-Earnings of 16x: Is it justified?
Berkshire Hathaway currently trades on a price-to-earnings ratio of 16x at a share price of $501.34, which places it at a premium to the broader US Diversified Financial industry but still below its direct peer group.
The price-to-earnings multiple compares what investors are willing to pay today for each dollar of current earnings, making it a useful lens for a mature, diversified business like Berkshire that generates substantial and recurring profits.
In this case, the market is assigning Berkshire a 16x multiple that is slightly higher than the industry average of 13.9x. This suggests investors are willing to pay more than they do for a typical diversified financial company, yet still less than the 26.8x average commanded by its closest peers, and notably close to our estimated fair price-to-earnings level of 16.9x that our analysis suggests the market could gravitate toward over time.
Compared with the US Diversified Financial industry, Berkshire’s 16x price-to-earnings ratio looks expensive relative to the 13.9x benchmark. However, when stacked against a much richer 26.8x peer average and an estimated fair multiple of 16.9x, the stock appears priced with a modest quality premium rather than aggressive optimism.
Explore the SWS fair ratio for Berkshire Hathaway
Result: Price-to-Earnings of 16x (ABOUT RIGHT)
However, there are still risks, including slowing net income alongside strong revenue growth and the possibility that analysts have already fully priced in the quality of Berkshire.
Find out about the key risks to this Berkshire Hathaway narrative.
Another View, Using Our DCF Model
Our SWS DCF model presents a different perspective. At $501.34, Berkshire trades around 34% below our estimated fair value of $764.77. This suggests meaningful undervaluation rather than a fully priced compounder. Is the market underestimating Berkshire’s long runway, or is the model too generous?
Look into how the SWS DCF model arrives at its fair value.
Simply Wall St performs a discounted cash flow (DCF) on every stock in the world every day (check out Berkshire Hathaway for example). We show the entire calculation in full. You can track the result in your watchlist or portfolio and be alerted when this changes, or use our stock screener to discover 901 undervalued stocks based on their cash flows. If you save a screener we even alert you when new companies match - so you never miss a potential opportunity.
Build Your Own Berkshire Hathaway Narrative
If you see the story differently or want to dig into the numbers yourself, you can craft a personalized Berkshire thesis in just a few minutes: Do it your way.
A great starting point for your Berkshire Hathaway research is our analysis highlighting 1 key reward and 2 important warning signs that could impact your investment decision.
Looking for more investment ideas?
Do not stop at Berkshire when you can quickly scan hand picked opportunities on Simply Wall St, where every idea comes with data driven context and valuation.
- Capture mispriced potential with these 901 undervalued stocks based on cash flows to spotlight companies trading below what their cash flows and fundamentals suggest they are worth.
- Ride powerful secular trends by using these 24 AI penny stocks to focus on businesses building real products and revenues around artificial intelligence.
- Lock in reliable income streams by checking these 10 dividend stocks with yields > 3% which features companies that pair attractive yields with sustainable payout profiles.
This article by Simply Wall St is general in nature. We provide commentary based on historical data and analyst forecasts only using an unbiased methodology and our articles are not intended to be financial advice. It does not constitute a recommendation to buy or sell any stock, and does not take account of your objectives, or your financial situation. We aim to bring you long-term focused analysis driven by fundamental data. Note that our analysis may not factor in the latest price-sensitive company announcements or qualitative material. Simply Wall St has no position in any stocks mentioned.
Have feedback on this article? Concerned about the content? Get in touch with us directly. Alternatively, email editorial-team@simplywallst.com