
 Nasdaq
 华尔街日报
华尔街日报Subaru (TSE:7270) Valuation Check After Strong Year-to-Date Share Price Rally
Subaru (TSE:7270) has been drifting slightly higher this week, but the real story is how its strong year to date and past 3 months rally stack up against still moderate earnings growth.
See our latest analysis for Subaru.
That near 24% year to date share price return and solid multi year total shareholder returns suggest momentum is still building as investors steadily price in Subaru's improving earnings base and reduced cyclical risk.
If Subaru's move has you watching the auto space more closely, it could be a good moment to explore other auto manufacturers that might fit your watchlist next.
With Subaru now trading slightly above analyst targets despite only modest earnings growth, investors face a key question: is this steady compounder still mispriced, or is the market already baking in the next leg of growth?
Price-to-Earnings of 9.2x: Is it justified?
Subaru's current share price of ¥3410 implies a price to earnings ratio of 9.2 times, suggesting the market is still pricing it at a discount to peers despite the strong share price run up.
The price to earnings multiple compares what investors are paying for each unit of current earnings, which is particularly relevant for a cyclical, profit generating automaker like Subaru. At 9.2 times earnings, the market appears to be assigning a relatively conservative value to its profit base given its long term earnings growth record, even as short term earnings have been volatile.
Subaru screens as good value on several fronts, trading on a 9.2 times price to earnings ratio versus about 14 times for similar peers and roughly 18.9 times for the wider Asian auto industry. Our fair price to earnings estimate of 14.6 times is also materially higher than where the stock trades today. This suggests scope for the valuation multiple to move closer to that level if Subaru continues to deliver on its earnings forecasts.
Explore the SWS fair ratio for Subaru
Result: Price-to-Earnings of 9.2x (UNDERVALUED)
However, Subaru's premium positioning leaves it exposed to any sharp US demand slowdown or yen strength, which could quickly compress margins and dent sentiment.
Find out about the key risks to this Subaru narrative.
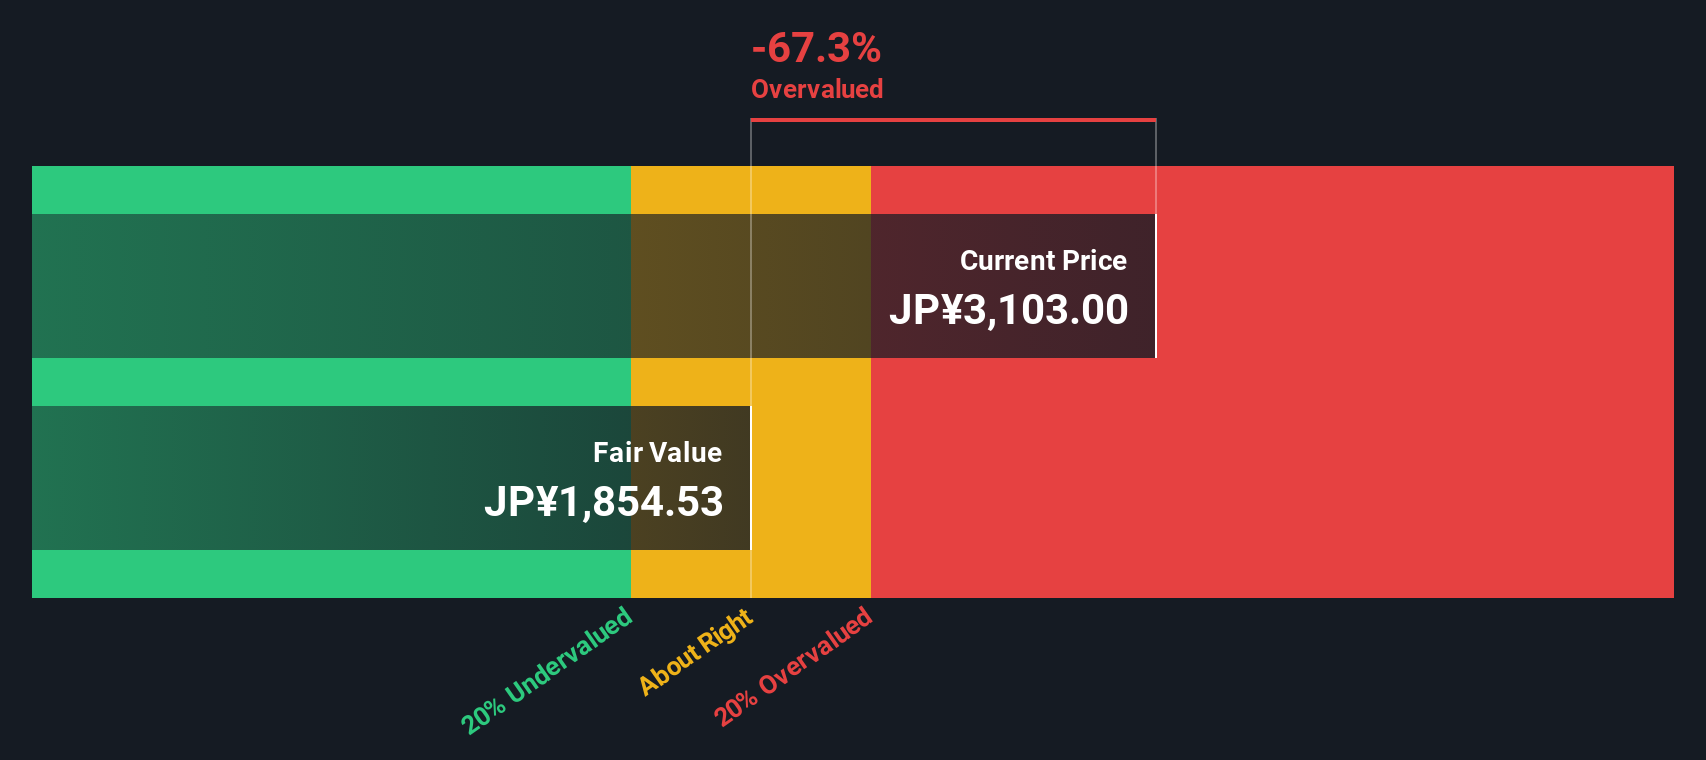
Another View: Our DCF Model Sends a Different Signal
While the 9.2 times earnings multiple hints at value, our DCF model paints a tougher picture. It puts fair value nearer ¥2279 versus the current ¥3410, which screens as overvalued. Is the market betting on stronger growth than the cash flows currently support?
Look into how the SWS DCF model arrives at its fair value.
Simply Wall St performs a discounted cash flow (DCF) on every stock in the world every day (check out Subaru for example). We show the entire calculation in full. You can track the result in your watchlist or portfolio and be alerted when this changes, or use our stock screener to discover 901 undervalued stocks based on their cash flows. If you save a screener we even alert you when new companies match - so you never miss a potential opportunity.
Build Your Own Subaru Narrative
If our view does not quite match yours, dive into the numbers and assemble a custom Subaru thesis in just a few minutes, Do it your way.
A great starting point for your Subaru research is our analysis highlighting 3 key rewards and 2 important warning signs that could impact your investment decision.
Looking for your next smart move?
Before the market’s next swing leaves you on the sidelines, put your research to work by locking in fresh, data driven stock ideas with the Simply Wall Street screener.
- Capture potential mispricings by targeting companies trading below intrinsic value using these 901 undervalued stocks based on cash flows backed by detailed cash flow analysis.
- Position your portfolio for structural growth by focusing on innovation leaders through these 24 AI penny stocks at the forefront of artificial intelligence.
- Strengthen your income stream by screening for reliable payers and growing yields via these 10 dividend stocks with yields > 3% that can support long term compounding.
This article by Simply Wall St is general in nature. We provide commentary based on historical data and analyst forecasts only using an unbiased methodology and our articles are not intended to be financial advice. It does not constitute a recommendation to buy or sell any stock, and does not take account of your objectives, or your financial situation. We aim to bring you long-term focused analysis driven by fundamental data. Note that our analysis may not factor in the latest price-sensitive company announcements or qualitative material. Simply Wall St has no position in any stocks mentioned.
Have feedback on this article? Concerned about the content? Get in touch with us directly. Alternatively, email editorial-team@simplywallst.com