
 Nasdaq
 华尔街日报
华尔街日报Is Paycom a Bargain After Its 20% Share Price Slide in 2025?
- If you are wondering whether Paycom Software is a hidden bargain or a value trap at today’s price, this article will walk you through what the numbers are really saying.
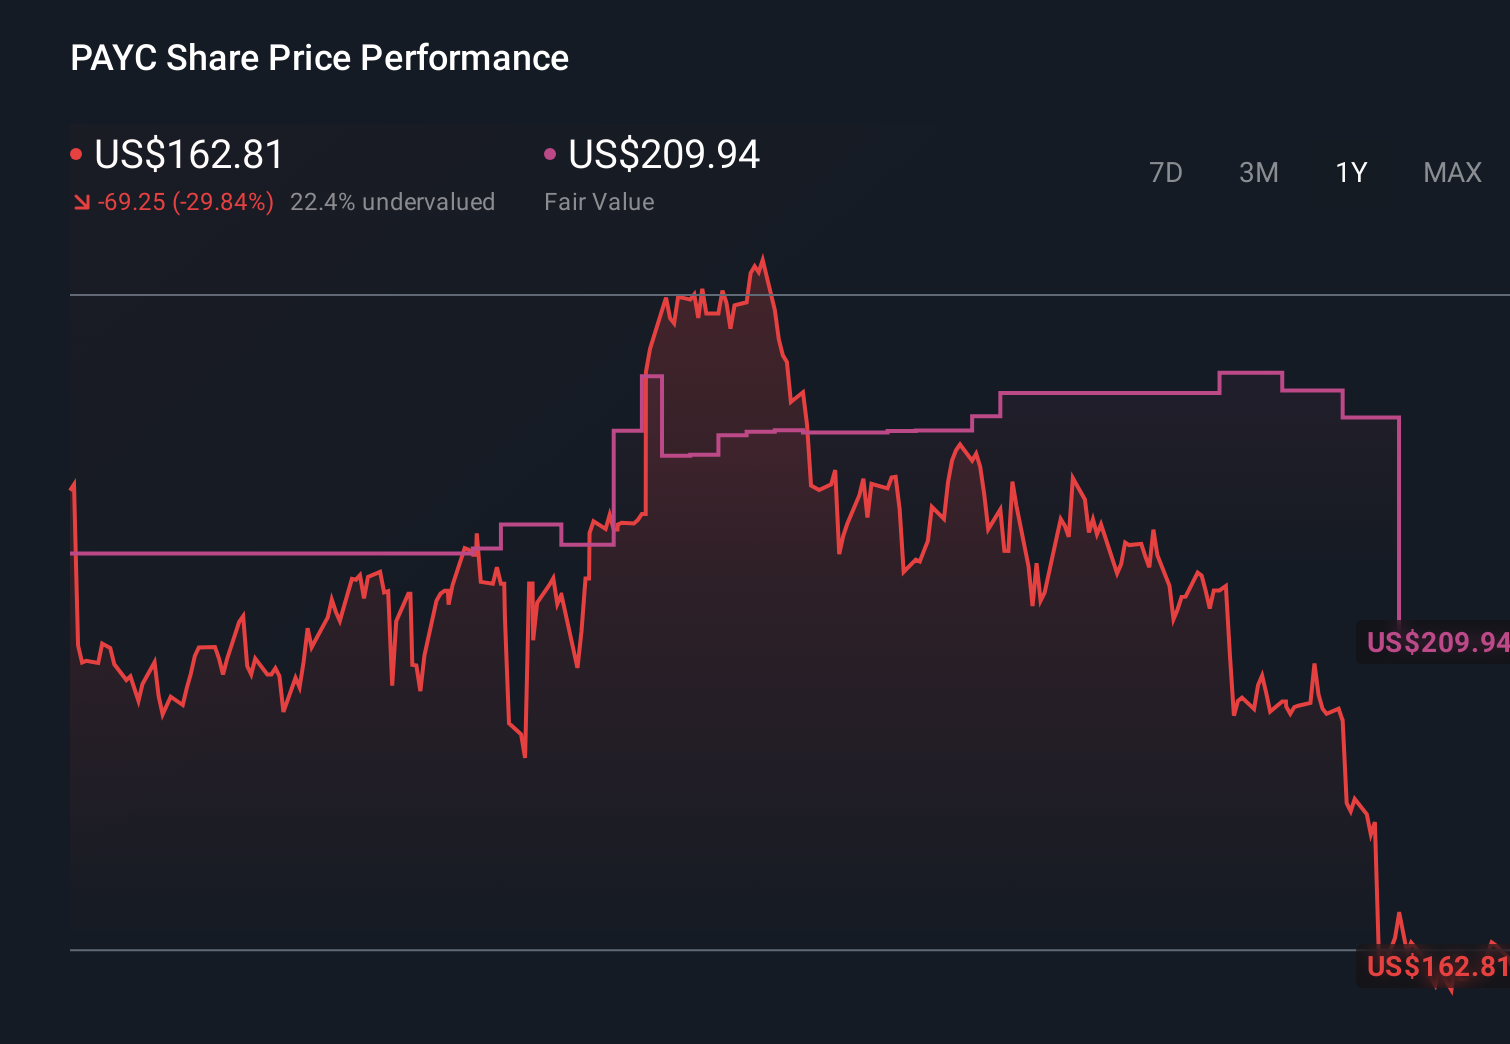
- The stock has had a rough run, with the share price down 20.4% year to date and 23.0% over the last year, even though it has been roughly flat over the past month at 0.7%.
- Investors have been digesting a mix of headlines around competition in payroll and HR software and Paycom’s ongoing push to win larger enterprise clients. This shift can both pressure margins and support long term growth. There has also been renewed attention on how quickly mid sized businesses are adopting cloud based payroll platforms, a key factor shaping sentiment around Paycom’s future growth runway.
- Despite the weak share performance, our valuation checks currently give Paycom a 6/6 valuation score, suggesting the stock screens as undervalued across all our metrics. Next we will break down those methods and introduce an even more insightful way to think about valuation by the end of the article.
Find out why Paycom Software's -23.0% return over the last year is lagging behind its peers.
Approach 1: Paycom Software Discounted Cash Flow (DCF) Analysis
A Discounted Cash Flow model estimates what a business is worth today by projecting how much cash it can generate in the future and then discounting those cash flows back to their value in today’s dollars.
For Paycom Software, the model starts with last twelve months Free Cash Flow of about $410 million and builds a 2 Stage Free Cash Flow to Equity forecast. Analyst estimates drive the early years and Simply Wall St extrapolates beyond that, with projected Free Cash Flow rising to roughly $1.25 billion by 2035 as growth gradually moderates.
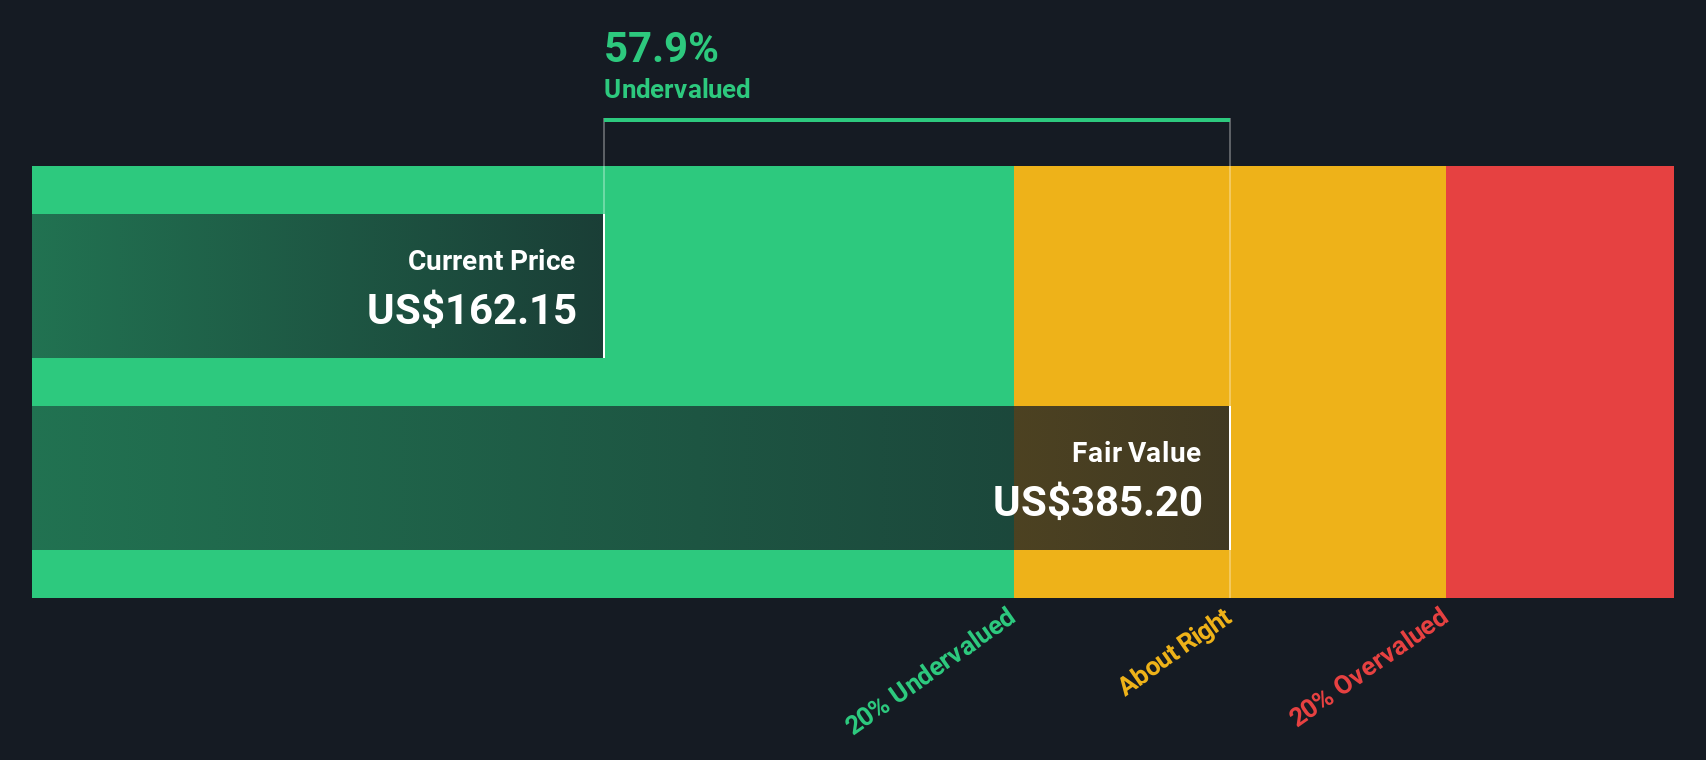
Adding up these discounted cash flows gives an estimated intrinsic value of about $408 per share. Compared with the current share price, the DCF implies Paycom is trading at a 60.7% discount to its calculated fair value. This suggests the market is pricing in a much weaker long term outlook than this model assumes.
Result: UNDERVALUED
Our Discounted Cash Flow (DCF) analysis suggests Paycom Software is undervalued by 60.7%. Track this in your watchlist or portfolio, or discover 901 more undervalued stocks based on cash flows.
Approach 2: Paycom Software Price vs Earnings
For profitable companies like Paycom, the price to earnings, or PE, ratio is a practical way to gauge whether investors are paying a reasonable price for today’s earnings. In general, faster growing and lower risk businesses tend to justify a higher, or more generous, PE multiple, while slower growing or riskier companies should trade on a lower multiple.
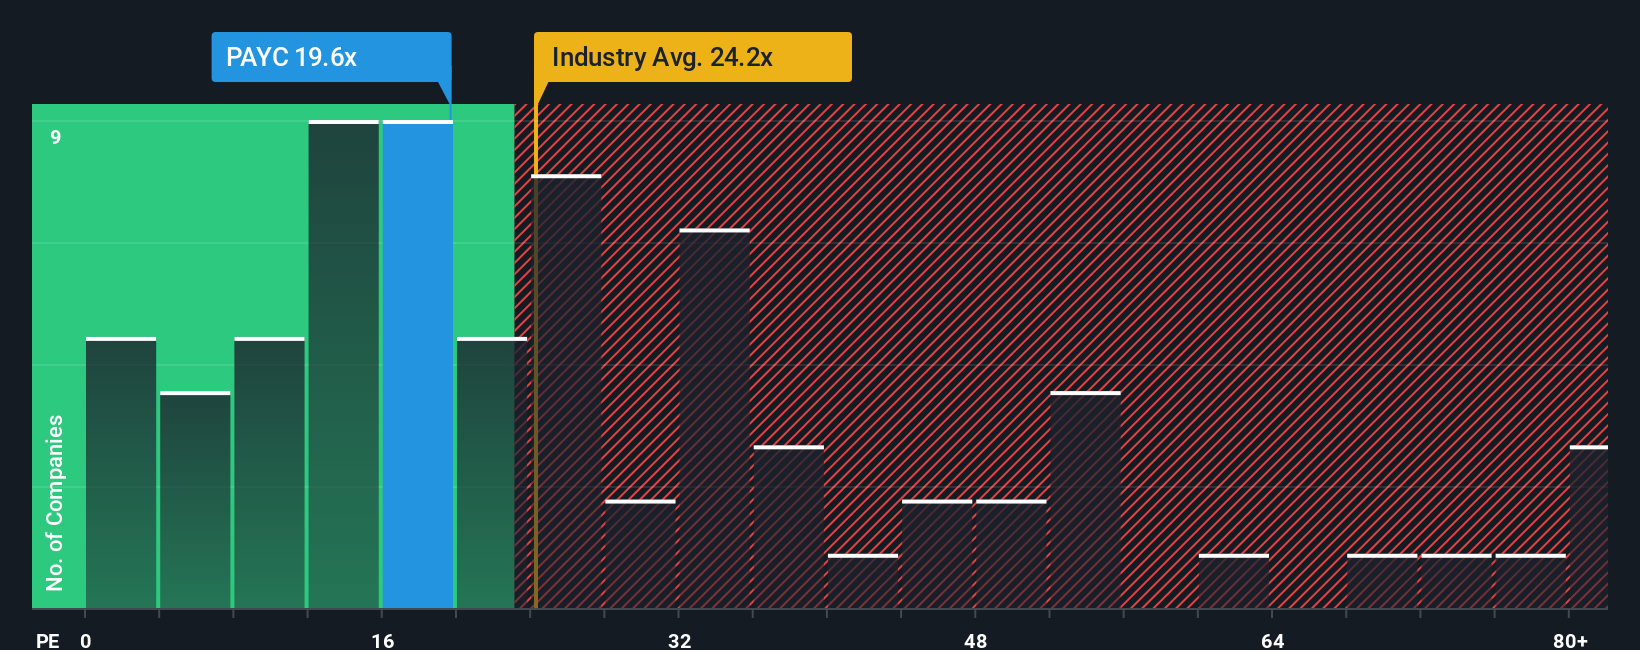
Paycom currently trades on a PE of about 19.4x, which is below both the Professional Services industry average of roughly 24.2x and the peer group average of around 22.2x. On the surface, that discount suggests the market is more cautious about Paycom’s outlook than it is about many of its peers.
Simply Wall St’s Fair Ratio framework goes a step further by estimating what PE multiple a stock should trade on after adjusting for its earnings growth profile, profitability, industry, market cap and specific risks. For Paycom, this Fair Ratio is 24.7x, noticeably higher than the current 19.4x. Because the stock trades well below this model derived level, the PE based view aligns with the DCF work and indicates potential undervaluation rather than a value trap.
Result: UNDERVALUED
PE ratios tell one story, but what if the real opportunity lies elsewhere? Discover 1460 companies where insiders are betting big on explosive growth.
Upgrade Your Decision Making: Choose your Paycom Software Narrative
Earlier we mentioned that there is an even better way to understand valuation, so let us introduce you to Narratives, which are simply your own story about a company, tying your view of its future revenue, earnings and margins to a specific fair value estimate. On Simply Wall St’s Community page, Narratives let you connect the dots from, for example, believing Paycom’s AI driven single database platform will keep winning share and expanding margins, through a detailed forecast, to a higher fair value closer to the most bullish analyst target of about $310, or, alternatively, taking a more cautious stance that slower industry growth and commoditisation will cap upside and justify something nearer the most bearish target of roughly $208. Narratives make this process accessible by turning those assumptions into a dynamic fair value that sits right next to today’s share price, so you can quickly see whether your story says “buy,” “hold,” or “sell,” and because they update as new news or earnings arrive, your view, numbers and fair value stay aligned with the latest information.
Do you think there's more to the story for Paycom Software? Head over to our Community to see what others are saying!
This article by Simply Wall St is general in nature. We provide commentary based on historical data and analyst forecasts only using an unbiased methodology and our articles are not intended to be financial advice. It does not constitute a recommendation to buy or sell any stock, and does not take account of your objectives, or your financial situation. We aim to bring you long-term focused analysis driven by fundamental data. Note that our analysis may not factor in the latest price-sensitive company announcements or qualitative material. Simply Wall St has no position in any stocks mentioned.
Have feedback on this article? Concerned about the content? Get in touch with us directly. Alternatively, email editorial-team@simplywallst.com