
 Nasdaq
 华尔街日报
华尔街日报Exploring US High Growth Tech Stocks In December 2025
As the U.S. stock market continues to reach new heights with the S&P 500 and Dow Jones Industrial Average setting all-time records, investor attention remains sharply focused on high growth sectors such as technology. In this environment, identifying promising tech stocks involves looking for companies that not only demonstrate strong innovation and adaptability but also show resilience amidst broader market trends and economic indicators.
Top 10 High Growth Tech Companies In The United States
| Name | Revenue Growth | Earnings Growth | Growth Rating |
|---|---|---|---|
| Marker Therapeutics | 75.24% | 59.07% | ★★★★★★ |
| Sanmina | 31.01% | 33.24% | ★★★★★☆ |
| Palantir Technologies | 28.00% | 32.57% | ★★★★★★ |
| Workday | 11.13% | 32.18% | ★★★★★☆ |
| Circle Internet Group | 23.08% | 84.58% | ★★★★★☆ |
| RenovoRx | 71.45% | 71.45% | ★★★★★☆ |
| Zscaler | 15.85% | 45.93% | ★★★★★☆ |
| Cellebrite DI | 15.29% | 20.24% | ★★★★★☆ |
| Procore Technologies | 11.70% | 116.48% | ★★★★★☆ |
| Duos Technologies Group | 53.36% | 152.11% | ★★★★★☆ |
Click here to see the full list of 72 stocks from our US High Growth Tech and AI Stocks screener.
Let's explore several standout options from the results in the screener.
Viridian Therapeutics (VRDN)
Simply Wall St Growth Rating: ★★★★★☆
Overview: Viridian Therapeutics, Inc. focuses on discovering, developing, and commercializing treatments for serious and rare diseases with a market cap of $3.08 billion.
Operations: The company generates revenue primarily from discovering, developing, and commercializing potential best-in-class medicines for serious and rare diseases, with reported revenues of $70.79 million.
Viridian Therapeutics has shown a significant turnaround with its recent revenue surge to $70.57 million in Q3 from just $0.086 million the previous year, marking a dramatic 56.3% annual growth rate. This leap is underscored by strategic advancements, including the promising BLA submission of veligrotug for thyroid eye disease, supported by robust phase 3 data showing notable clinical benefits. Despite a net loss reduction to $34.6 million from $76.69 million, reflecting improved operational efficiency, the company's aggressive R&D commitment is evident with substantial investments aimed at pioneering treatments in biotechnology—a sector ripe for rapid expansion and innovation.

Clearfield (CLFD)
Simply Wall St Growth Rating: ★★★★☆☆
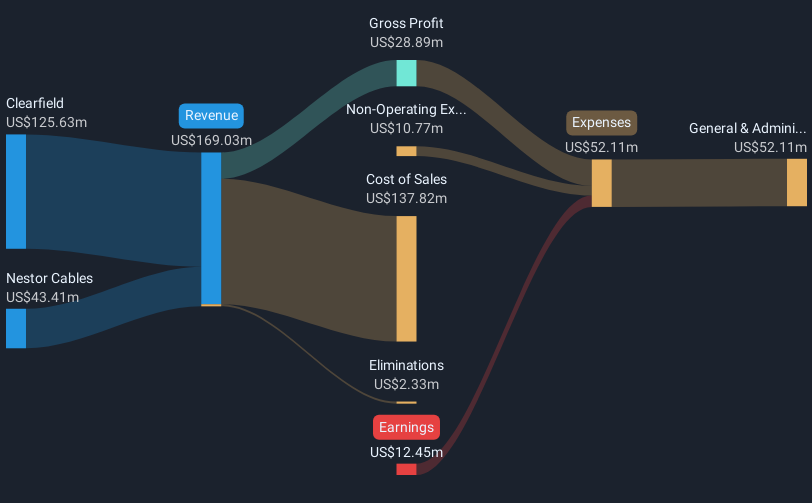
Overview: Clearfield, Inc. designs, manufactures, and distributes fiber management, protection, and delivery products both in the United States and internationally with a market capitalization of $407.28 million.
Operations: Clearfield focuses on the fiber management sector, generating revenue of $150.13 million from its core operations. The company operates primarily in the United States and internationally, leveraging its expertise in designing and manufacturing specialized products for fiber protection and delivery.
Clearfield's trajectory in the tech sector is marked by a robust annual earnings growth of 46.2%, significantly outpacing the US market average of 16.2%. This growth is complemented by a notable increase in annual revenue, up 14.3% year-over-year, showcasing a strategic alignment with market demands and innovation trends. The company has successfully transitioned to profitability this year, reflecting operational efficiencies and a keen focus on expanding its technological footprint. Moreover, Clearfield's commitment to R&D is evident from its recent amendments to corporate governance aimed at bolstering future tech advancements, positioning it well within the competitive landscape of high-growth technology sectors.
- Get an in-depth perspective on Clearfield's performance by reading our health report here.
Review our historical performance report to gain insights into Clearfield's's past performance.
VTEX (VTEX)
Simply Wall St Growth Rating: ★★★★☆☆
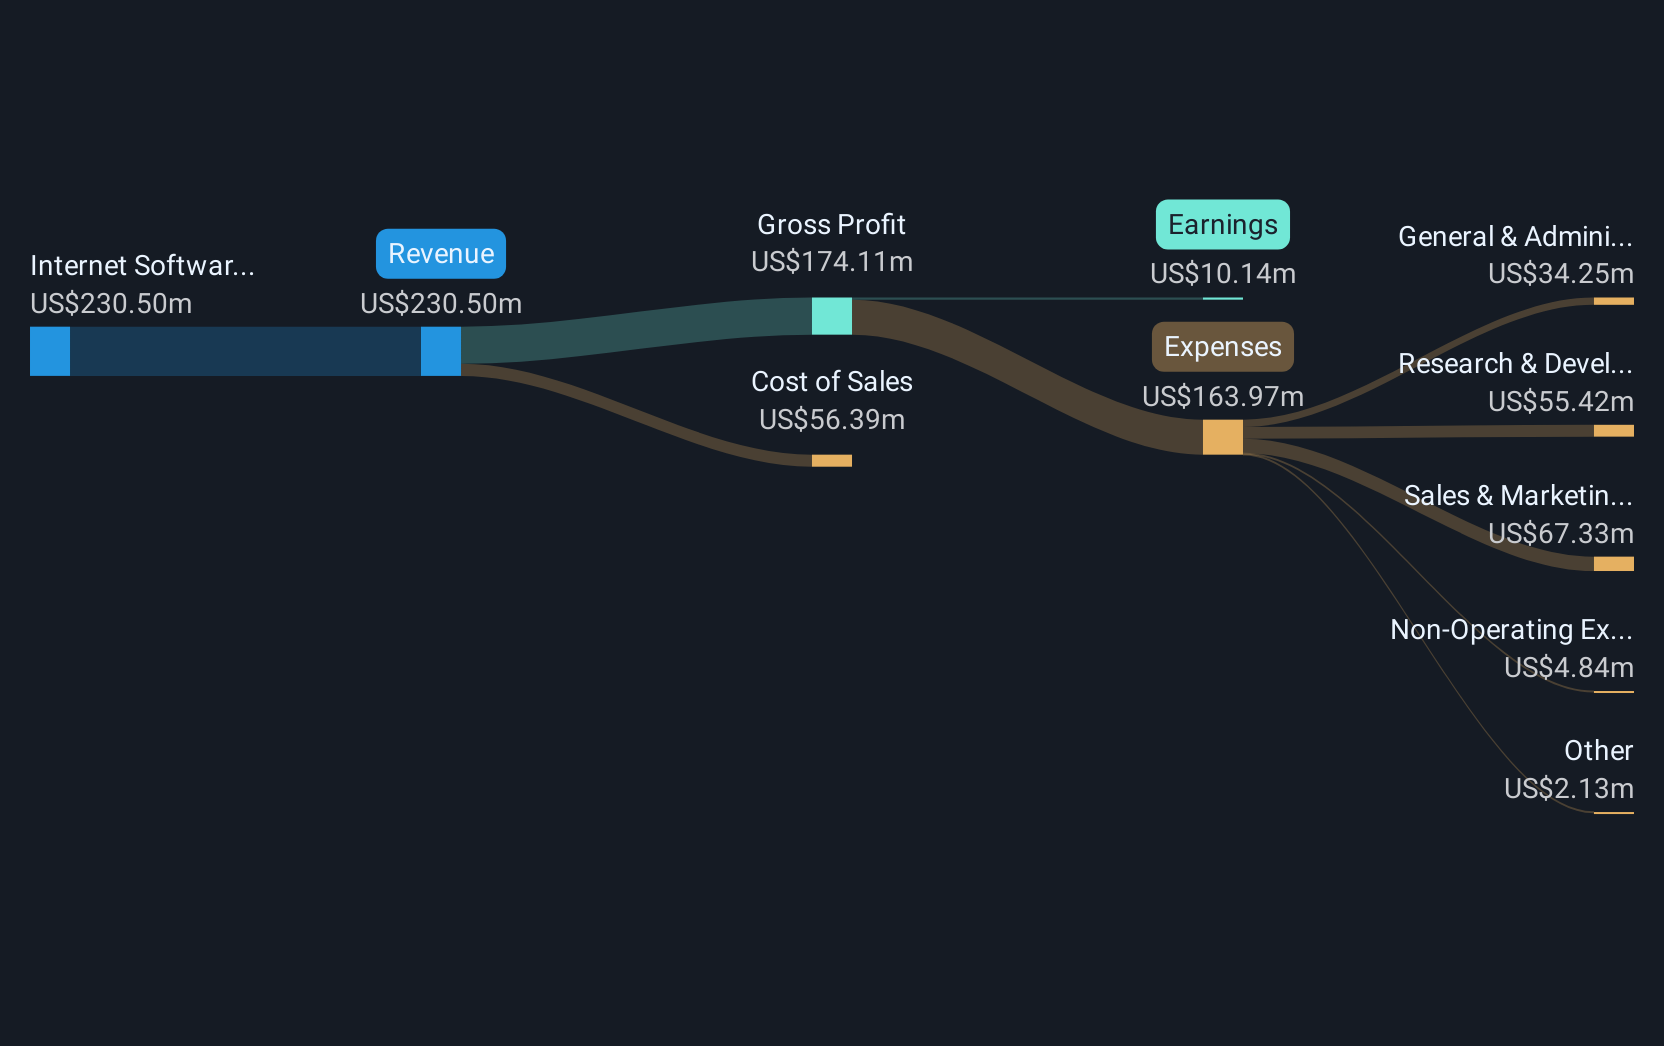
Overview: VTEX, with a market cap of $662.77 million, offers a software-as-a-service digital commerce platform tailored for enterprise brands and retailers through its subsidiaries.
Operations: The company generates revenue primarily from its Internet Software & Services segment, amounting to $234.12 million. The platform serves enterprise brands and retailers, focusing on providing digital commerce solutions through a software-as-a-service model.
VTEX, a player in the e-commerce platform sector, has demonstrated robust financial health with third-quarter revenue rising to $59.61 million from $55.99 million year-over-year and net income increasing to $6.35 million from $3.37 million in the same period. This growth is underpinned by a strategic emphasis on R&D, aligning with industry trends towards enhanced digital commerce solutions. Notably, the company's earnings per share have also seen an uptick from $0.018 to $0.035, reflecting operational efficiencies and market adaptability. Moreover, VTEX's proactive approach in returning value to shareholders is evident from its recent buyback of 6,266,348 shares for $27.59 million, showcasing confidence in its financial trajectory and commitment to shareholder interests.
- Navigate through the intricacies of VTEX with our comprehensive health report here.
Understand VTEX's track record by examining our Past report.
Summing It All Up
- Discover the full array of 72 US High Growth Tech and AI Stocks right here.
- Shareholder in one or more of these companies? Ensure you're never caught off-guard by adding your portfolio in Simply Wall St for timely alerts on significant stock developments.
- Simply Wall St is your key to unlocking global market trends, a free user-friendly app for forward-thinking investors.
Searching for a Fresh Perspective?
- Explore high-performing small cap companies that haven't yet garnered significant analyst attention.
- Fuel your portfolio with companies showing strong growth potential, backed by optimistic outlooks both from analysts and management.
- Find companies with promising cash flow potential yet trading below their fair value.
This article by Simply Wall St is general in nature. We provide commentary based on historical data and analyst forecasts only using an unbiased methodology and our articles are not intended to be financial advice. It does not constitute a recommendation to buy or sell any stock, and does not take account of your objectives, or your financial situation. We aim to bring you long-term focused analysis driven by fundamental data. Note that our analysis may not factor in the latest price-sensitive company announcements or qualitative material. Simply Wall St has no position in any stocks mentioned.
Have feedback on this article? Concerned about the content? Get in touch with us directly. Alternatively, email editorial-team@simplywallst.com