
 Nasdaq
 华尔街日报
华尔街日报Is RTX’s 2025 Valuation Stretched After a 61% Year Long Surge?
- Wondering if RTX is still worth buying after its huge run up, or if the easy money has already been made? In this article, we break down what the current price might really be telling you about potential future returns.
- RTX has climbed 5.2% over the last week, 7.6% over the past month, and 60.7% year to date, capping off a 62.5% gain over 1 year and a gain that has nearly tripled investors’ money over 3 years. Those kinds of moves naturally raise the question of whether the stock is now priced for perfection.
- Recent headlines have focused on RTX’s positioning as a key defense and aerospace supplier as geopolitical tensions keep long term demand expectations elevated. At the same time, investors are weighing ongoing execution on large programs and strategic portfolio moves that aim to sharpen the company’s focus and cash generation.
- Despite that backdrop, RTX only scores 1/6 on our valuation checks, suggesting it screens as undervalued on just one of several metrics. Next we will unpack what different valuation approaches say about RTX today, and later in the article we will look at a more nuanced way to think about its true worth beyond any single model.
RTX scores just 1/6 on our valuation checks. See what other red flags we found in the full valuation breakdown.
Approach 1: RTX Discounted Cash Flow (DCF) Analysis
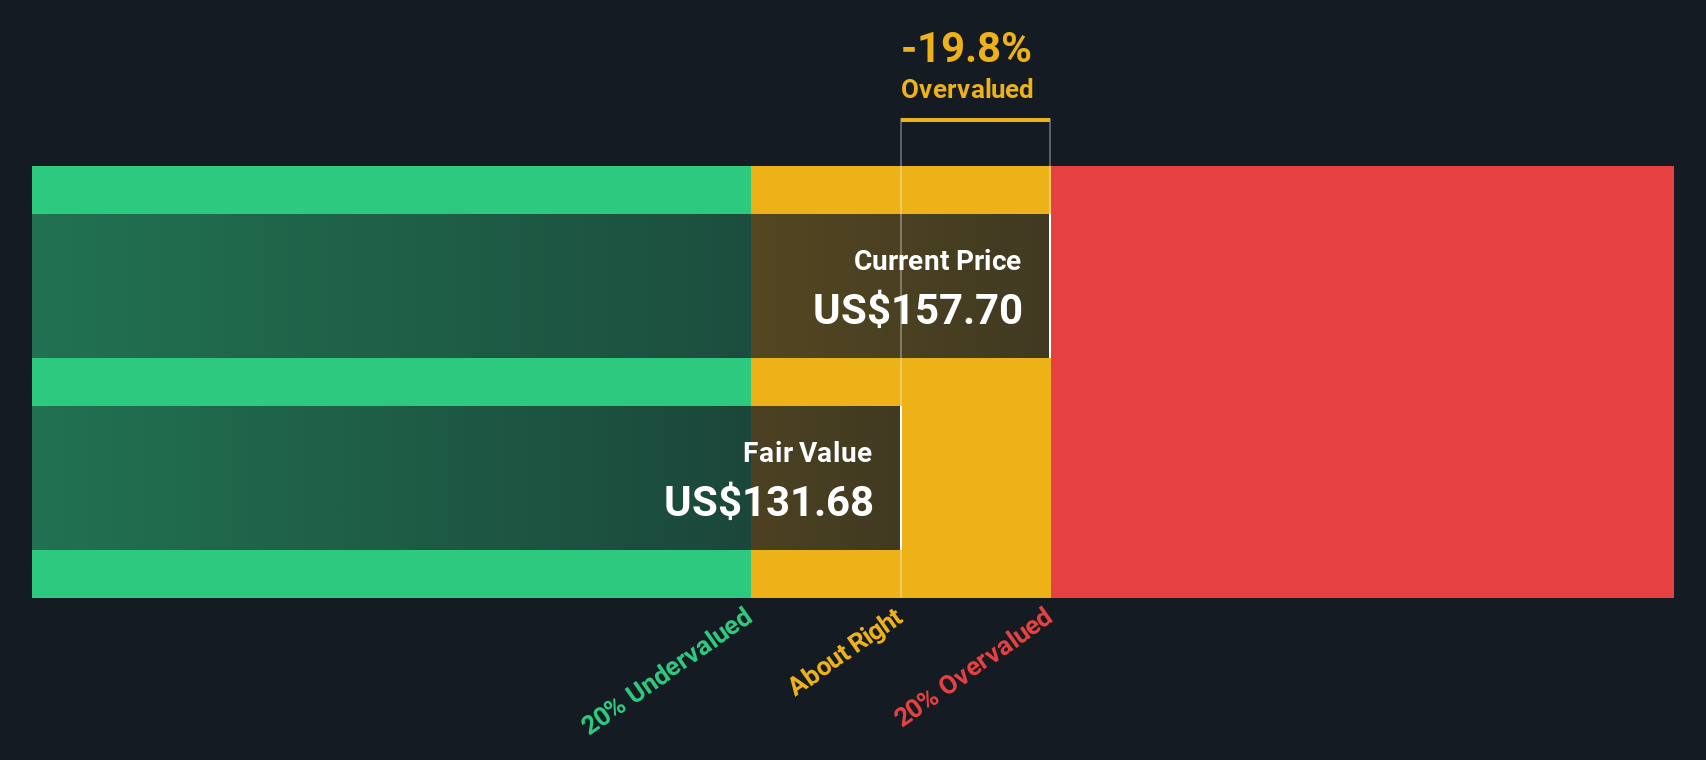
A Discounted Cash Flow (DCF) model estimates what a company is worth today by forecasting its future cash flows and discounting them back to the present. For RTX, the model uses a 2 Stage Free Cash Flow to Equity approach based on cash flow projections.
RTX generated trailing twelve month free cash flow of about $4.5 Billion. Analyst and extrapolated forecasts suggest this could rise to roughly $12.4 Billion by 2035, with intermediate projections such as around $8.5 Billion in 2026 and about $10.8 Billion by 2029. Earlier years are based on analyst estimates, while later years are extrapolated by Simply Wall St to extend the growth trajectory.
When all those future cash flows are discounted back and summed, the model arrives at an intrinsic value of about $149.48 per share. Compared with the current share price, this implies RTX is roughly 24.7% overvalued on a pure DCF basis, suggesting expectations embedded in the stock are already quite optimistic.
Result: OVERVALUED
Our Discounted Cash Flow (DCF) analysis suggests RTX may be overvalued by 24.7%. Discover 904 undervalued stocks or create your own screener to find better value opportunities.
Approach 2: RTX Price vs Earnings
For profitable, established businesses like RTX, the price to earnings, or PE, ratio is a useful yardstick because it links what investors pay today to the profits the company is already generating. In general, faster expected earnings growth and lower perceived risk justify a higher PE, while slower growth or higher uncertainty call for a lower, more conservative multiple.
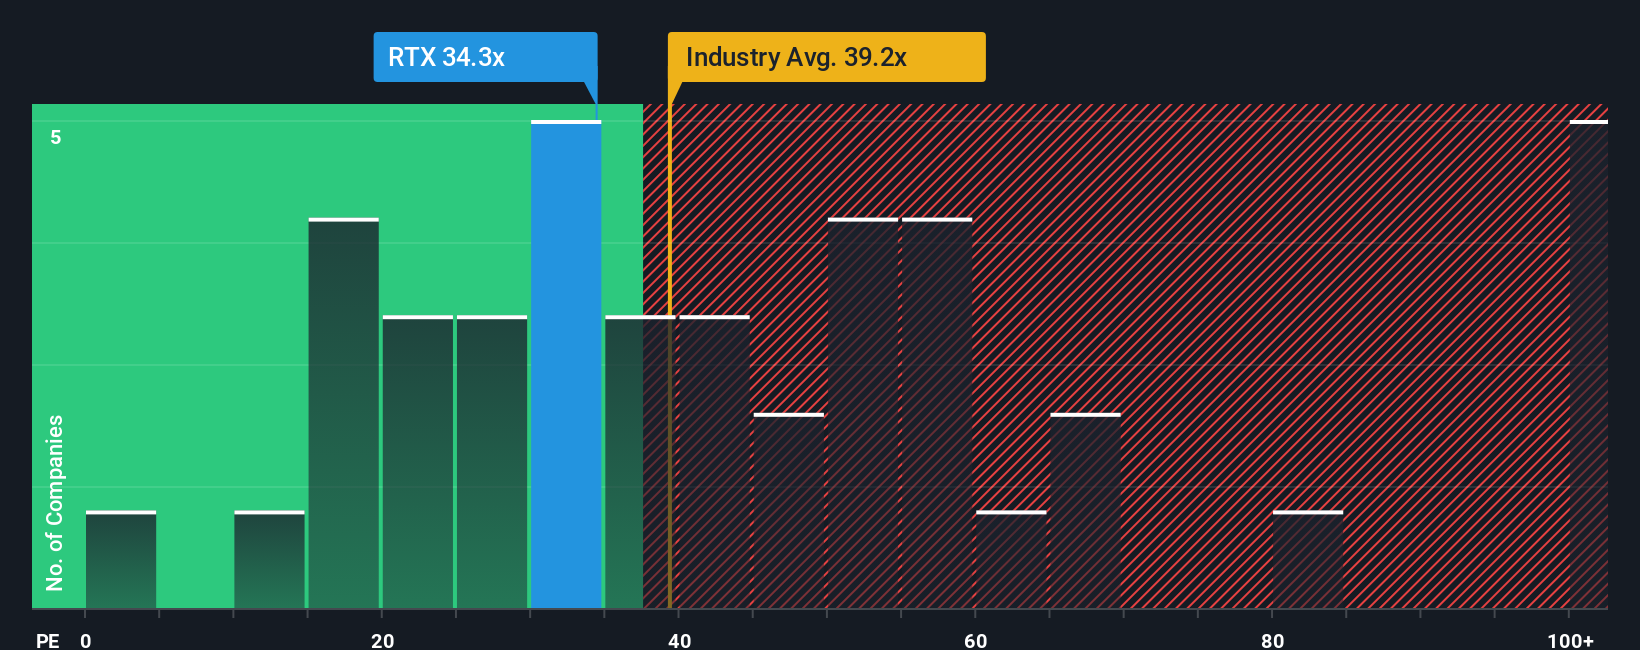
RTX currently trades at about 37.9x earnings. That is very close to both the Aerospace and Defense industry average of around 38.0x and the peer group average of roughly 37.3x, suggesting the market is valuing RTX broadly in line with comparable companies. Simply Wall St also calculates a proprietary Fair Ratio of about 35.7x, which is the PE one might expect for RTX after accounting for its earnings growth outlook, profitability, risk profile, industry positioning and market cap.
This Fair Ratio is more tailored than a simple peer or industry comparison because it blends company specific drivers like margins and risk with broader sector dynamics. With RTX trading at 37.9x versus a Fair Ratio of 35.7x, the stock appears slightly expensive on an earnings basis.
Result: OVERVALUED
PE ratios tell one story, but what if the real opportunity lies elsewhere? Discover 1460 companies where insiders are betting big on explosive growth.
Upgrade Your Decision Making: Choose your RTX Narrative
Earlier we mentioned that there is an even better way to understand valuation. Let us introduce you to Narratives, a simple framework on Simply Wall St’s Community page where you connect your view of RTX’s story to a set of concrete forecasts for revenue, earnings and margins. These then flow through to a fair value estimate you can compare with today’s share price to decide whether it looks like a buy or a sell. The estimate will automatically update as new news or earnings arrive so your thesis stays current. For example, one RTX Narrative might lean into surging missile demand and long term defense budgets and land on a fair value closer to about $195 per share. A more cautious view that emphasizes engine reliability, cybersecurity risks and budget uncertainty might anchor around $134 per share. This shows how different investors can look at the same business, tell a different story with the numbers, and still use Narratives as an accessible, dynamic tool to make more deliberate decisions about when to act.
Do you think there's more to the story for RTX? Head over to our Community to see what others are saying!

This article by Simply Wall St is general in nature. We provide commentary based on historical data and analyst forecasts only using an unbiased methodology and our articles are not intended to be financial advice. It does not constitute a recommendation to buy or sell any stock, and does not take account of your objectives, or your financial situation. We aim to bring you long-term focused analysis driven by fundamental data. Note that our analysis may not factor in the latest price-sensitive company announcements or qualitative material. Simply Wall St has no position in any stocks mentioned.
Have feedback on this article? Concerned about the content? Get in touch with us directly. Alternatively, email editorial-team@simplywallst.com