
 Nasdaq
 华尔街日报
华尔街日报Does Target’s Recent Slide and Rebound Signal a Missed Opportunity for Investors?
- If you are wondering whether Target at around $96 a share is a bargain or a value trap, you are not alone. This article will walk through exactly how the numbers stack up.
- Despite being down 29.6% year to date and 23.9% over the last year, the stock has risen 14.2% in the past month, even after a mild 2.1% pullback over the last week. This hints that sentiment might be starting to shift.
- Recent headlines have focused on Target's strategic push into owned brands, store remodels and supply chain upgrades, all aimed at boosting margins and customer loyalty over the long run. At the same time, investors are watching how the company navigates shifting consumer spending patterns and competition from peers in both discount and online retail, which helps explain the stock's choppy performance.
- On our framework of six valuation checks, Target scores a solid 5 out of 6. This suggests it looks undervalued on several fronts. Next, we will break down those methods one by one before finishing with an intuitive way to think about what the stock might really be worth.
Find out why Target's -23.9% return over the last year is lagging behind its peers.
Approach 1: Target Discounted Cash Flow (DCF) Analysis
A Discounted Cash Flow model estimates what a business is worth today by projecting the cash it could generate in the future and then discounting those cash flows back to the present.
For Target, the latest twelve month Free Cash Flow is about $2.9 billion. Analysts and extrapolations expect Free Cash Flow to fluctuate but generally grow over time, reaching roughly $3.9 billion by 2035 based on the 2 Stage Free Cash Flow to Equity model. Simply Wall St uses analyst forecasts for the next few years and then tapers growth to more conservative levels in later years.
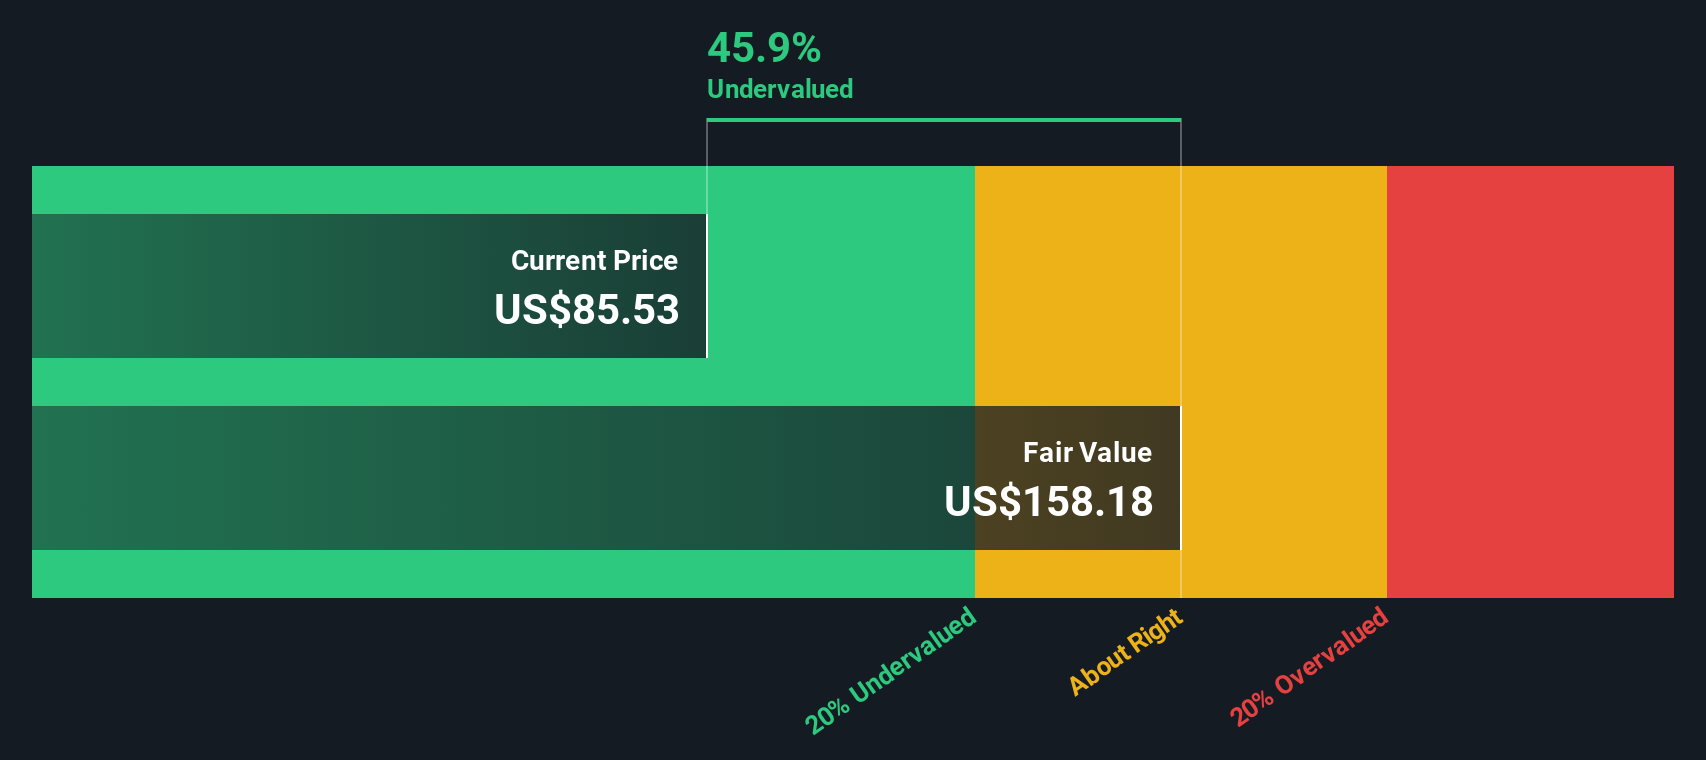
When all those projected cash flows are discounted back to today, the model arrives at an intrinsic value of about $139.85 per share. With the stock trading around $96, the DCF implies Target is trading at roughly a 31.0% discount to its estimated fair value, which suggests the market may be underpricing its long term cash generating potential.
Result: UNDERVALUED
Our Discounted Cash Flow (DCF) analysis suggests Target is undervalued by 31.0%. Track this in your watchlist or portfolio, or discover 904 more undervalued stocks based on cash flows.
Approach 2: Target Price vs Earnings
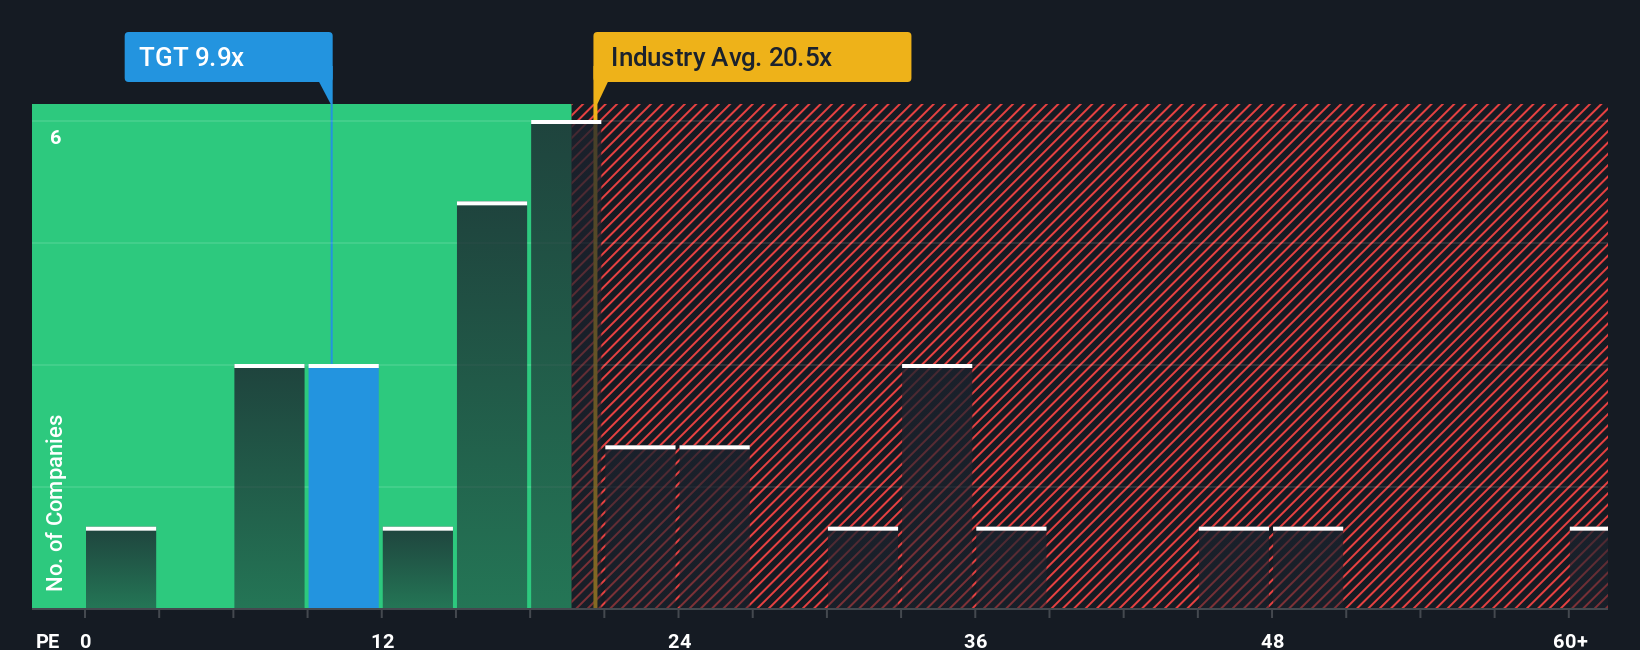
For a profitable, mature retailer like Target, the Price to Earnings ratio is a practical way to gauge valuation because it links what investors pay for each share directly to the company’s current earnings power.
In general, companies with stronger growth prospects and lower perceived risk tend to justify a higher, or more “normal” PE ratio, while slower growth or higher risk usually means investors should demand a lower multiple. Today, Target trades at about 11.6x earnings, which is well below both the Consumer Retailing industry average of roughly 21.8x and the broader peer group average of around 28.3x.
Simply Wall St also calculates a “Fair Ratio” for Target of about 19.5x. This is the PE multiple the company might reasonably deserve after factoring in its earnings growth outlook, margins, industry, market cap and risk profile. This Fair Ratio is more tailored than a simple peer or industry comparison because it adjusts for company specific strengths and weaknesses rather than assuming all retailers deserve the same multiple. Comparing the Fair Ratio of 19.5x with the current PE of 11.6x suggests the market is pricing Target at a meaningful discount to what its fundamentals might warrant.
Result: UNDERVALUED
PE ratios tell one story, but what if the real opportunity lies elsewhere? Discover 1460 companies where insiders are betting big on explosive growth.
Upgrade Your Decision Making: Choose your Target Narrative
Earlier we mentioned that there is an even better way to understand valuation, so let us introduce you to Narratives, which are simply your story about a company linked directly to a set of numbers such as expected revenue, earnings, margins and ultimately a fair value estimate. On Simply Wall St’s Community page, millions of investors use Narratives as an easy, accessible tool to connect what they believe about a business, like Target’s ability to win younger shoppers or protect margins, with a concrete financial forecast and a Fair Value they can compare to today’s share price to decide whether to buy, hold or sell. Narratives update dynamically as new information, such as earnings or major news, comes in, so your view of Target’s worth automatically reflects the latest data. For example, one investor might build a cautious Target Narrative closer to the low analyst price target around $82 because they expect slower growth and margin pressure, while another might create a more optimistic Narrative nearer $135, assuming successful execution on digital, private labels and efficiency improvements.
Do you think there's more to the story for Target? Head over to our Community to see what others are saying!

This article by Simply Wall St is general in nature. We provide commentary based on historical data and analyst forecasts only using an unbiased methodology and our articles are not intended to be financial advice. It does not constitute a recommendation to buy or sell any stock, and does not take account of your objectives, or your financial situation. We aim to bring you long-term focused analysis driven by fundamental data. Note that our analysis may not factor in the latest price-sensitive company announcements or qualitative material. Simply Wall St has no position in any stocks mentioned.
Have feedback on this article? Concerned about the content? Get in touch with us directly. Alternatively, email editorial-team@simplywallst.com