
 Nasdaq
 华尔街日报
华尔街日报Flex (FLEX): Revisiting Valuation After a Multi‑Year Share Price Rerating
Flex (FLEX) has quietly turned into one of the market’s steadier compounders, with the stock up roughly 64% this year and about 3x over the past 3 years.
See our latest analysis for Flex.
The stock’s 30 day share price return of 11.59 percent on a last close of 63.55 dollars builds on strong year to date momentum. Flex’s three year total shareholder return above 300 percent shows this has been a sustained, rerating story rather than a quick trade.
Given that kind of run, it can be worth seeing what else fits a similar profile, so you might also explore fast growing stocks with high insider ownership as a source of fresh ideas beyond Flex.
With shares already tripling in three years and analysts still seeing upside, Flex now sits at the crossroads of strong execution and lofty expectations. This raises the question: is there still a buying opportunity, or is future growth fully priced in?
Most Popular Narrative Narrative: 13.6% Undervalued
With Flex closing at 63.55 dollars against a narrative fair value in the low 70s, the current setup implies meaningful upside if the long term thesis lands.
The ongoing surge in demand for data center and AI infrastructure requiring integrated power, cooling, and advanced IT hardware positions Flex for sustained, outsized revenue growth, as evidenced by the 35% forecasted annual increase in its data center segment, supporting both topline expansion and higher portfolio margins. Flex's global manufacturing footprint, especially its ability to regionalize and rapidly scale production across North America and Europe, aligns with accelerating customer efforts to de risk and diversify supply chains.
Curious how modest top line growth, rising margins, and a richer yet lower future earnings multiple can still point to upside from here? The narrative breaks down the earnings bridge, buyback impact, and valuation path that together underpin this fair value call.
Result: Fair Value of $73.51 (UNDERVALUED)
Have a read of the narrative in full and understand what's behind the forecasts.
However, concentrated hyperscaler exposure and structurally thin margins mean that any client loss or pricing pressure could quickly derail the current upside narrative.
Find out about the key risks to this Flex narrative.
Another Angle on Valuation
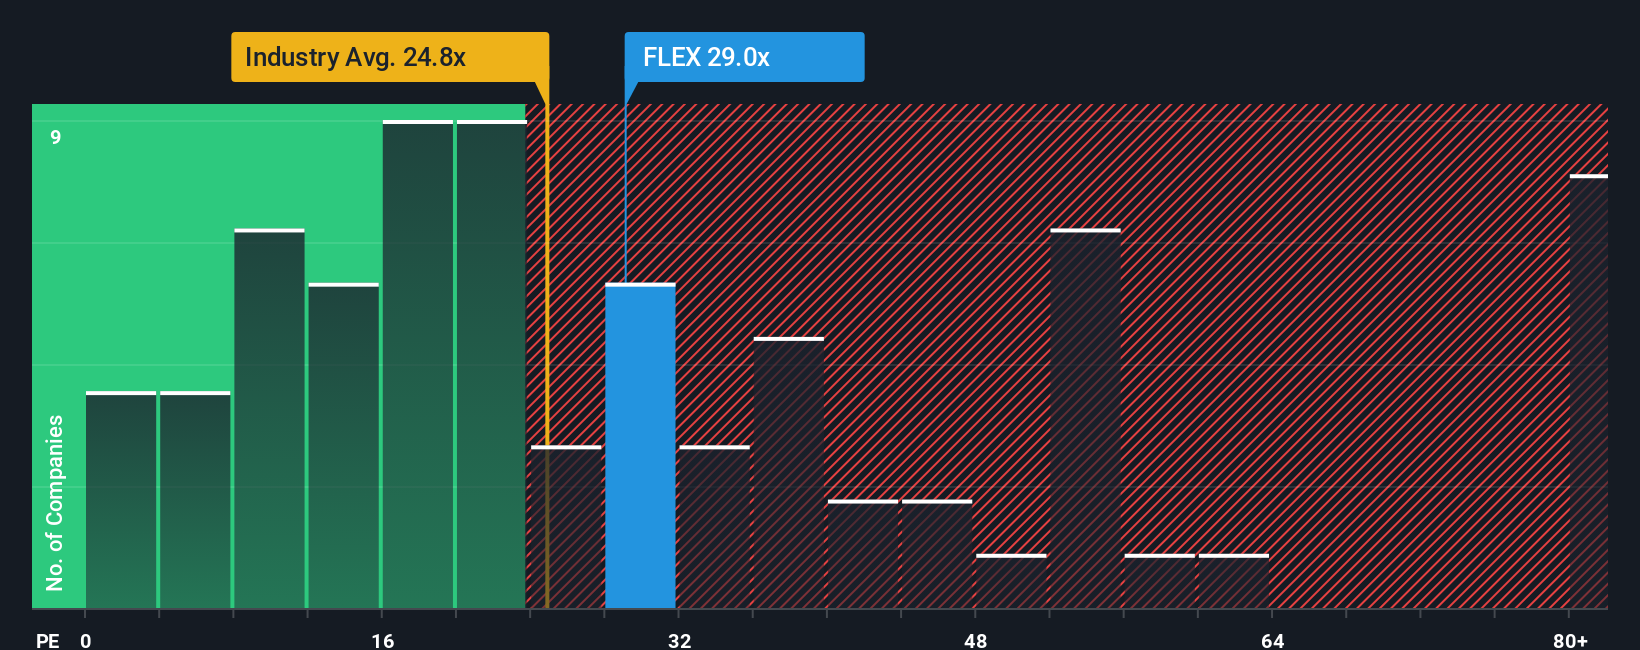
On earnings, the picture looks less forgiving. Flex trades on roughly 26.8 times profit versus about 24.9 times for the US Electronic industry, yet our fair ratio suggests the market could justify closer to 32 times. Is this a margin of safety or a premium with little room for missteps?
See what the numbers say about this price — find out in our valuation breakdown.
Build Your Own Flex Narrative
If you see the story differently or want to test your own assumptions against the numbers, you can build a full narrative in minutes: Do it your way.
A great starting point for your Flex research is our analysis highlighting 3 key rewards and 1 important warning sign that could impact your investment decision.
Ready for your next investing edge?
Before you move on, lock in your momentum by scanning a few targeted stock ideas on Simply Wall Street that match different opportunity sets and risk appetites.
- Capture potential bargains by running through these 904 undervalued stocks based on cash flows that trade below what their cash flows suggest they are worth.
- Surf the AI growth wave by checking out these 24 AI penny stocks positioned at the forefront of automation and intelligent software.
- Secure reliable income streams with these 10 dividend stocks with yields > 3% offering yields above 3 percent without abandoning quality fundamentals.
This article by Simply Wall St is general in nature. We provide commentary based on historical data and analyst forecasts only using an unbiased methodology and our articles are not intended to be financial advice. It does not constitute a recommendation to buy or sell any stock, and does not take account of your objectives, or your financial situation. We aim to bring you long-term focused analysis driven by fundamental data. Note that our analysis may not factor in the latest price-sensitive company announcements or qualitative material. Simply Wall St has no position in any stocks mentioned.
Have feedback on this article? Concerned about the content? Get in touch with us directly. Alternatively, email editorial-team@simplywallst.com