
 Nasdaq
 华尔街日报
华尔街日报Has Vistra’s Soaring Multi Year Run Already Priced In Its Future Growth?
- If you are wondering whether Vistra is still a smart buy after its huge multi‑year run, or if most of the upside is already priced in, this breakdown can help you think through whether the current share price stacks up against its fundamentals.
- The stock has cooled off recently, slipping about 7.5% over the past month, even as it is still up 8.2% year to date and an eye‑catching 614.9% over 3 years and 824.0% over 5 years. This pattern hints at strong long‑term optimism alongside shifting short‑term risk perceptions.
- Those dramatic moves have come alongside rising investor attention on power markets and the build‑out of generation capacity in key US regions, as traders reassess how stable Vistra’s cash flows could be in a more electrified economy. At the same time, policy discussions around grid reliability and the energy transition have kept utilities like Vistra in the spotlight, reinforcing the idea that its strategy and asset mix matter as much as the headline share price.
- Right now Vistra scores a 2/6 valuation check score, suggesting it screens as undervalued on a couple of metrics but is far from a clear‑cut bargain. In what follows, we walk through different valuation approaches to explore why that might be and then finish with a more intuitive way to think about what the market is really paying for.
Vistra scores just 2/6 on our valuation checks. See what other red flags we found in the full valuation breakdown.
Approach 1: Vistra Discounted Cash Flow (DCF) Analysis
The Discounted Cash Flow model estimates what a business is worth today by projecting its future cash flows and then discounting those back to their value in today’s dollars.
For Vistra, the latest twelve month free cash flow stands at about $1.31 billion. Analyst forecasts and Simply Wall St extrapolations point to free cash flow rising to roughly $5.96 billion by 2029 and continuing to grow through the next decade, with projected figures climbing toward the $9 billion range by 2035. These projections are modeled using a 2 Stage Free Cash Flow to Equity approach, which assumes a faster growth phase before cash flows mature and then grow more steadily.
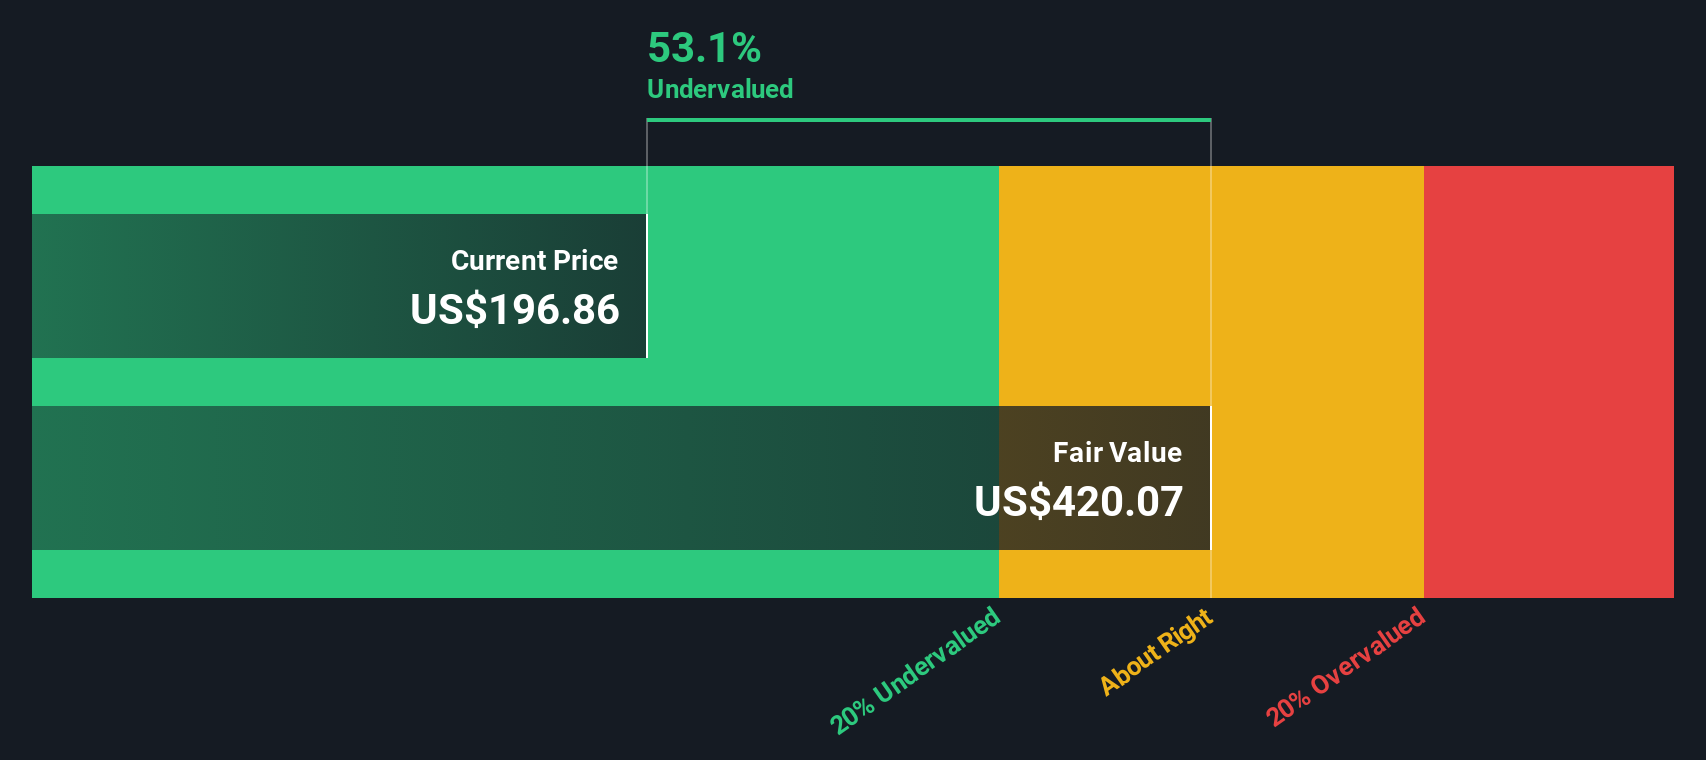
On this basis, the DCF model arrives at an estimated intrinsic value of about $404.64 per share. That implies the stock is trading at roughly a 60.0% discount to this fair value estimate, and suggests the market is pricing Vistra well below the long term cash flows that the company could generate in dollar terms.
Result: UNDERVALUED
Our Discounted Cash Flow (DCF) analysis suggests Vistra is undervalued by 60.0%. Track this in your watchlist or portfolio, or discover 904 more undervalued stocks based on cash flows.
Approach 2: Vistra Price vs Earnings
For profitable companies like Vistra, the price to earnings multiple is a practical way to gauge how much investors are willing to pay for each dollar of current earnings. It naturally blends expectations for future growth with perceptions of risk, since faster growing, more resilient businesses usually sustain higher PE ratios than slower, more cyclical names.
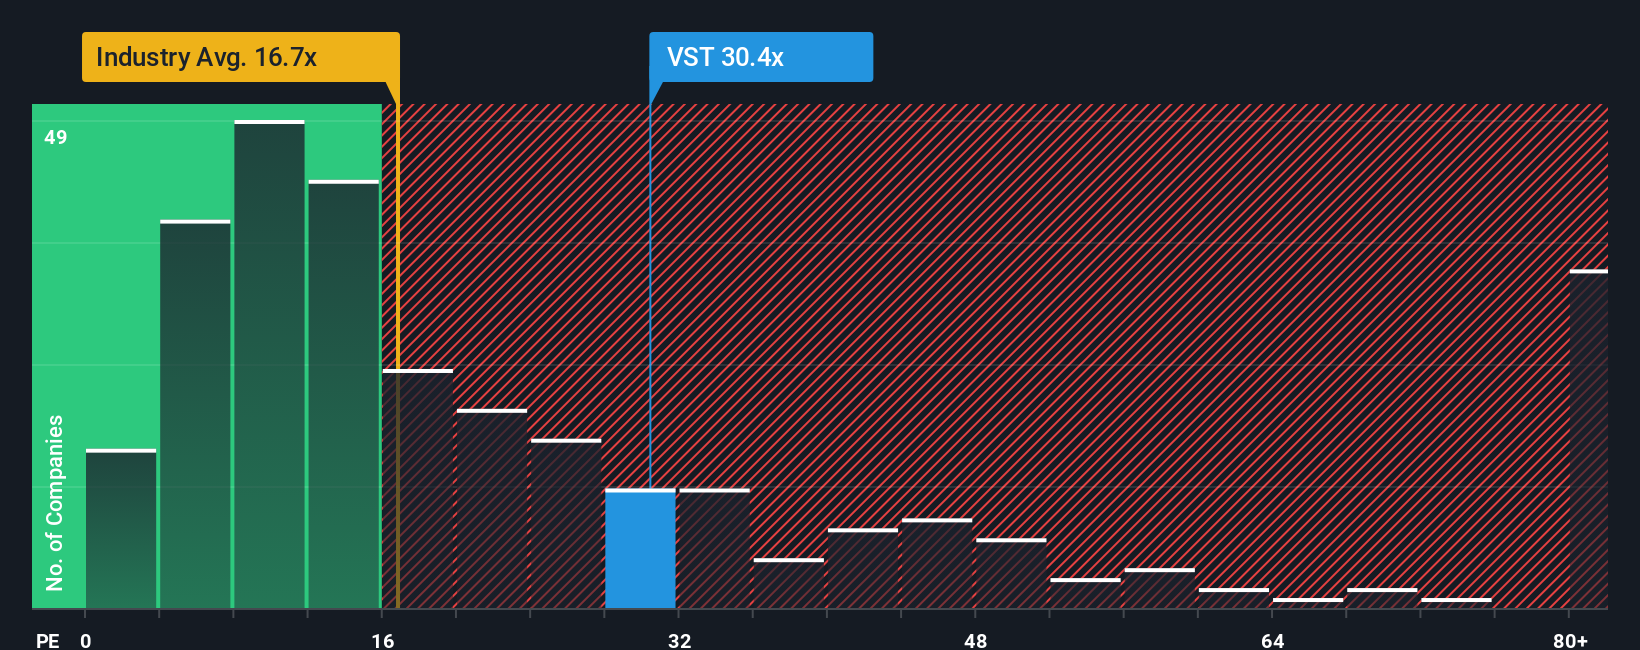
Vistra currently trades on a PE of about 57.16x, which is well above both the broader renewable energy industry average of roughly 16.57x and the peer group average near 30.41x. To put that in context, Simply Wall St’s proprietary Fair Ratio for Vistra is 47.60x, which reflects what investors might reasonably pay given its earnings growth outlook, profitability profile, size, sector and risk characteristics.
This Fair Ratio is more informative than a simple comparison with peers or the industry, because it adjusts for company specific drivers such as growth momentum, margin quality and business risk, rather than assuming one size fits all. With Vistra’s actual PE of 57.16x sitting noticeably above the 47.60x Fair Ratio, the multiple suggests the market is paying a premium to what those fundamentals alone would justify.
Result: OVERVALUED
PE ratios tell one story, but what if the real opportunity lies elsewhere? Discover 1460 companies where insiders are betting big on explosive growth.
Upgrade Your Decision Making: Choose your Vistra Narrative
Earlier we mentioned that there is an even better way to understand valuation, so let us introduce you to Narratives, a simple way to connect your view of Vistra’s story with a set of numbers like future revenue, earnings, margins and ultimately a fair value estimate.
A Narrative is your own investment storyline for a company, where you spell out what you think will drive the business, translate that into a financial forecast, and see what fair value that story implies.
On Simply Wall St’s Community page, Narratives are an easy, guided tool that lets millions of investors link a company’s qualitative story to quantitative forecasts and then compare the resulting fair value to today’s share price so they can consider whether Vistra looks like a buy, hold, or sell for their own situation.
Because Narratives update dynamically when new information arrives, such as earnings, contract announcements or regulatory news, your view of Vistra’s fair value can adapt in real time rather than staying locked to an outdated model.
For example, one Vistra Narrative might assume stronger demand, higher margins and a fair value around $261 per share, while a more cautious Narrative might bake in slower growth, tighter margins and a fair value closer to $164. Seeing where your own expectations sit between those anchors can help you evaluate how attractive the current price really is.
Do you think there's more to the story for Vistra? Head over to our Community to see what others are saying!
This article by Simply Wall St is general in nature. We provide commentary based on historical data and analyst forecasts only using an unbiased methodology and our articles are not intended to be financial advice. It does not constitute a recommendation to buy or sell any stock, and does not take account of your objectives, or your financial situation. We aim to bring you long-term focused analysis driven by fundamental data. Note that our analysis may not factor in the latest price-sensitive company announcements or qualitative material. Simply Wall St has no position in any stocks mentioned.
Have feedback on this article? Concerned about the content? Get in touch with us directly. Alternatively, email editorial-team@simplywallst.com