
 Nasdaq
 华尔街日报
华尔街日报DENSO (TSE:6902): Reassessing Valuation After Recent Share Price Outperformance
DENSO (TSE:6902) has quietly outperformed over the past month, rising about 3% even as its past 3 months have been choppy. That divergence has investors reassessing what the current valuation is really pricing in.
See our latest analysis for DENSO.
Zooming out, DENSO’s recent 3.39% 1 month share price return contrasts with a softer year to date share price performance. Its 1 year total shareholder return of 5.25% hints that momentum is stabilising rather than surging.
If DENSO’s mixed momentum has you thinking about the rest of the sector, this could be a good moment to scan auto manufacturers for other auto names with interesting setups.
With earnings still growing and the share price lagging its implied value, investors face a key question: is DENSO a quietly undervalued auto tech leader, or is the market already pricing in its next leg of growth?
Price-to-Earnings of 16x: Is it justified?
On a trailing price to earnings ratio of 16 times at a last close of ¥2,137.5, DENSO screens as relatively expensive versus peers and fair value benchmarks.
The price to earnings multiple compares the share price to per share earnings and is a widely used yardstick for profitable, mature manufacturers like DENSO. A higher ratio typically signals that investors are willing to pay more today for each unit of current earnings, often because they expect stronger or more resilient profits in the years ahead.
In DENSO’s case, that 16 times earnings tag sits slightly above the estimated fair price to earnings level of 15.7 times. This suggests the market is paying a premium to the level our regression based fair ratio implies. Investors are effectively front loading some of the expected 11.7 percent annual earnings growth into today’s price, rather than waiting for results to catch up.
Set against the broader Japanese Auto Components industry average of 10.6 times, DENSO’s multiple looks markedly richer. This underscores that the market views it as a higher quality or higher growth name than most suppliers. Compared with the peer group average of 15.8 times, the valuation premium is slimmer but still on the elevated side. This reinforces the idea that any stumble in execution or growth could be punished more quickly than for cheaper rivals.
Explore the SWS fair ratio for DENSO
Result: Price-to-Earnings of 16x (OVERVALUED)
However, risks remain, including a cyclical slowdown in global auto demand and execution missteps on EV and advanced safety systems that could quickly compress the multiple.
Find out about the key risks to this DENSO narrative.
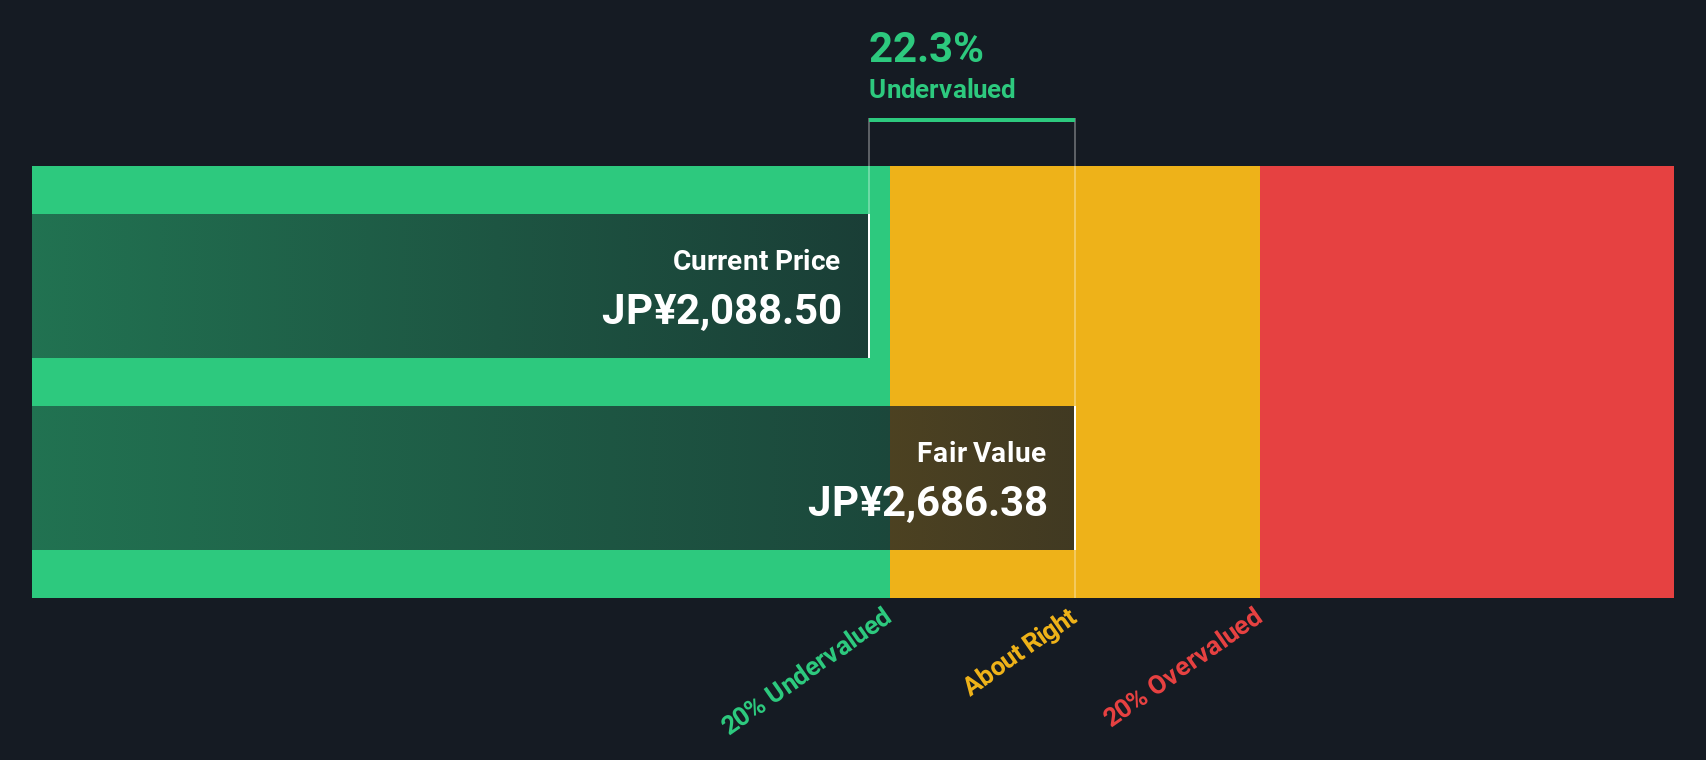
Another View: DCF Suggests Room to Run
While the 16 times earnings multiple looks stretched, our DCF model points the other way and indicates DENSO is trading about 26% below its fair value of roughly ¥2,899. If cash flows are closer to right than sentiment multiples, is the market underestimating this auto tech story?
Look into how the SWS DCF model arrives at its fair value.
Simply Wall St performs a discounted cash flow (DCF) on every stock in the world every day (check out DENSO for example). We show the entire calculation in full. You can track the result in your watchlist or portfolio and be alerted when this changes, or use our stock screener to discover 904 undervalued stocks based on their cash flows. If you save a screener we even alert you when new companies match - so you never miss a potential opportunity.
Build Your Own DENSO Narrative
If you see the story differently, or would rather dig into the numbers yourself, you can shape a custom view in just minutes: Do it your way
A great starting point for your DENSO research is our analysis highlighting 3 key rewards and 1 important warning sign that could impact your investment decision.
Ready for your next investing move?
Before you close this tab, lock in your momentum by scanning fresh opportunities on Simply Wall Street that could strengthen, diversify, and future proof your portfolio.
- Capture potential mispricings by acting on these 904 undervalued stocks based on cash flows that combine solid cash flows with attractive entry points.
- Ride powerful AI tailwinds by targeting these 24 AI penny stocks positioned at the heart of data driven innovation.
- Boost your income strategy by tapping into these 10 dividend stocks with yields > 3% offering yields that can meaningfully support long term returns.
This article by Simply Wall St is general in nature. We provide commentary based on historical data and analyst forecasts only using an unbiased methodology and our articles are not intended to be financial advice. It does not constitute a recommendation to buy or sell any stock, and does not take account of your objectives, or your financial situation. We aim to bring you long-term focused analysis driven by fundamental data. Note that our analysis may not factor in the latest price-sensitive company announcements or qualitative material. Simply Wall St has no position in any stocks mentioned.
Have feedback on this article? Concerned about the content? Get in touch with us directly. Alternatively, email editorial-team@simplywallst.com