
 Nasdaq
 华尔街日报
华尔街日报Is Rexford Industrial Realty Fairly Priced After Recent Pullback in 2025?
- If you are wondering whether Rexford Industrial Realty is quietly setting up for a better entry point or if the current price still reflects too much optimism, you are not alone in asking whether the stock offers genuine value right now.
- After a modest pullback of 3.3% over the last week and 2.4% over the past month, the stock is still up 3.6% year to date and about 7.6% over the last year, which points to a cautious but improving sentiment after a tougher 3 and 5 year stretch.
- Recent headlines around industrial REITs have focused on continued demand for logistics and warehouse space on the US West Coast and the ongoing impact of higher interest rates on property valuations. In that context, investors have been reassessing Rexford's portfolio quality and balance sheet strength as they weigh how sustainable its growth story really is.
- On our framework, Rexford Industrial Realty scores a 3/6 valuation check. This suggests it appears undervalued on some metrics but not across the board. Next, we will walk through those different approaches to valuation before finishing with an even more intuitive way to think about what the market might really be pricing in.
Find out why Rexford Industrial Realty's 7.6% return over the last year is lagging behind its peers.
Approach 1: Rexford Industrial Realty Discounted Cash Flow (DCF) Analysis
A Discounted Cash Flow model projects Rexford Industrial Realty's adjusted funds from operations into the future and then discounts those cash flows back to today in $ terms, to estimate what the business might be worth now.
On this basis, Rexford is generating roughly $543.16 Million in free cash flow today, with analysts and internal estimates pointing to steady growth over the next decade. By 2029, free cash flow is projected to be about $645.13 Million, and Simply Wall St extrapolates this further into the early 2030s, assuming moderating but positive growth each year.
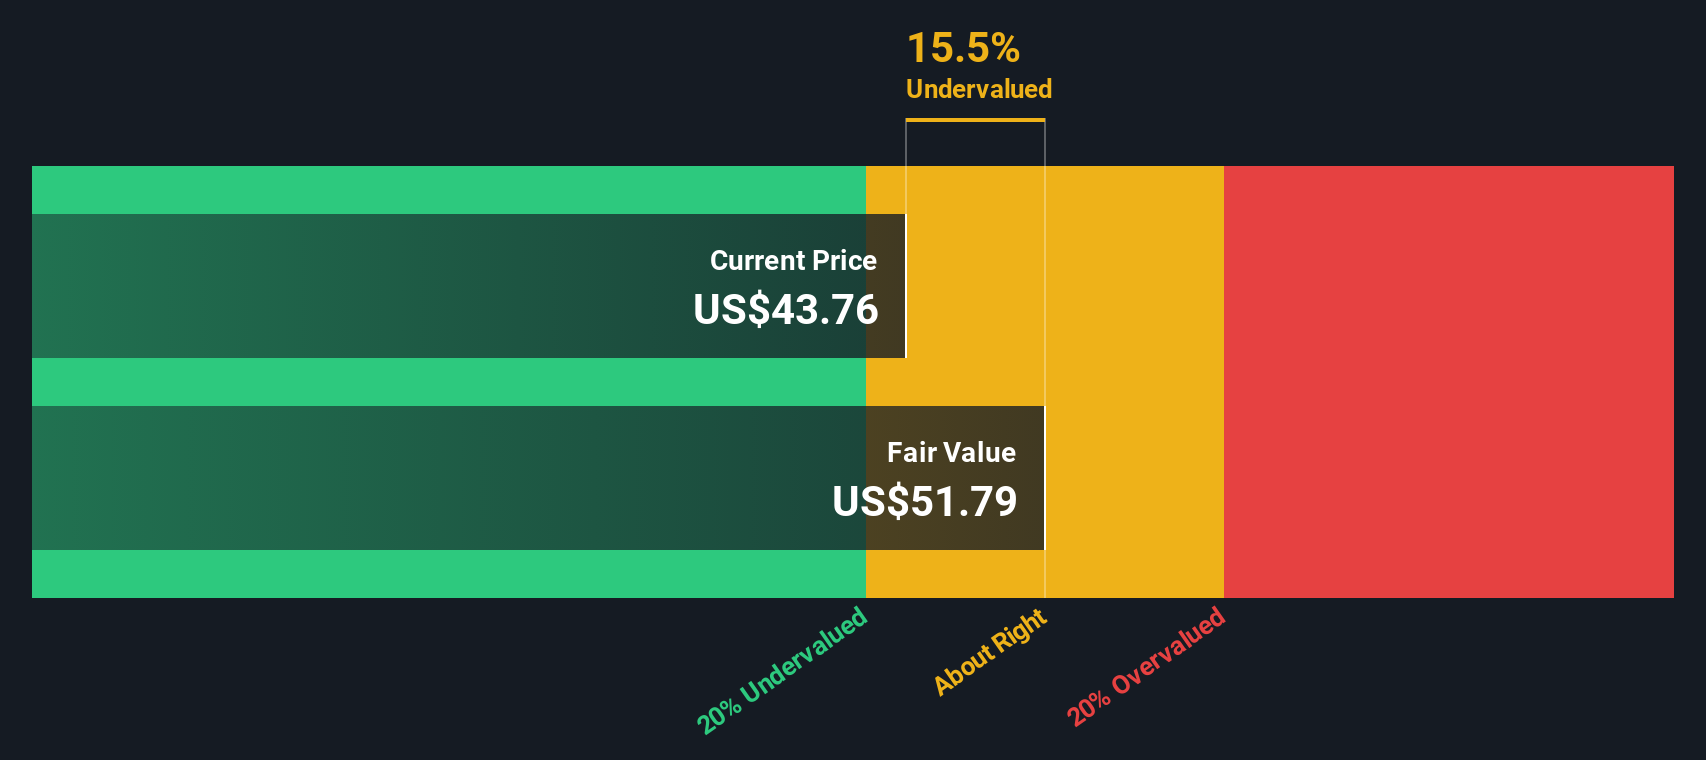
When those future cash flows are discounted back using a 2 stage Free Cash Flow to Equity model based on adjusted funds from operations, the intrinsic value comes out at about $44.92 per share. That is roughly an 11.4% discount to the current share price, which suggests the stock screens as modestly undervalued rather than deeply mispriced.
Result: UNDERVALUED
Our Discounted Cash Flow (DCF) analysis suggests Rexford Industrial Realty is undervalued by 11.4%. Track this in your watchlist or portfolio, or discover 904 more undervalued stocks based on cash flows.
Approach 2: Rexford Industrial Realty Price vs Earnings
For a profitable REIT like Rexford Industrial Realty, the price to earnings ratio is a useful way to see how much investors are willing to pay today for each dollar of current earnings. In general, stronger expected growth and lower perceived risk justify a higher PE, while slower growth or higher risk should pull the multiple down.
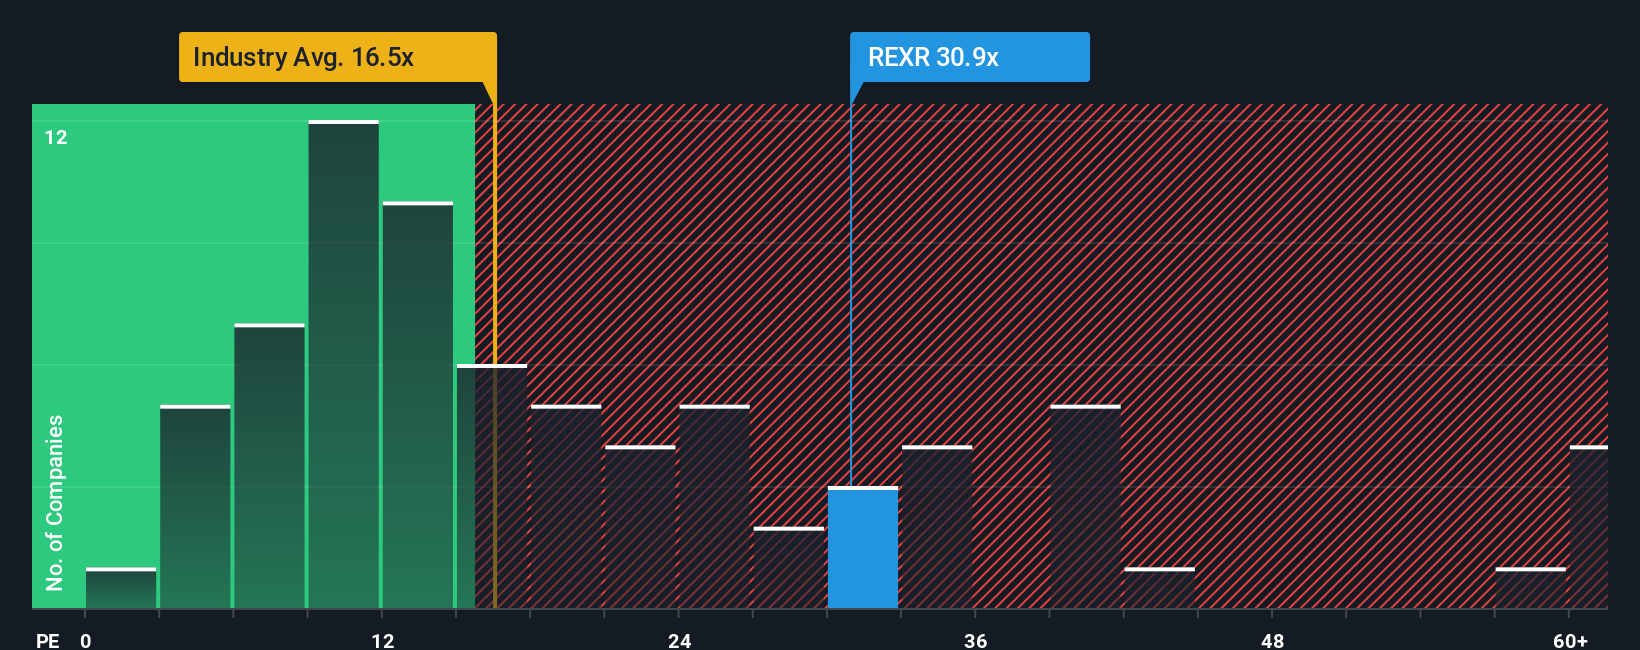
Rexford currently trades on about 28.18x earnings. That is a premium to the broader Industrial REITs industry average of roughly 16.67x, but a modest discount to the 30.02x average of its closest peers. To refine this comparison, Simply Wall St uses a proprietary Fair Ratio, which is the PE multiple you might expect once you factor in the company’s earnings growth outlook, profit margins, size, sector and specific risk profile. This Fair Ratio for Rexford is 30.19x, which is more tailored than a simple industry or peer average because it adjusts for what actually makes Rexford different rather than assuming all REITs deserve the same multiple. With the current PE sitting slightly below that Fair Ratio, the stock appears modestly undervalued on this metric.
Result: UNDERVALUED
PE ratios tell one story, but what if the real opportunity lies elsewhere? Discover 1460 companies where insiders are betting big on explosive growth.
Upgrade Your Decision Making: Choose your Rexford Industrial Realty Narrative
Earlier we mentioned that there is an even better way to understand valuation. Let us introduce you to Narratives, which let you attach a simple story about Rexford Industrial Realty to your numbers by linking your view of its future revenue, earnings and margins to a financial forecast and ultimately to a fair value estimate. You can then easily compare that estimate to the current share price to decide whether to buy, hold or sell.
On Simply Wall St’s Community page, millions of investors use Narratives as an accessible tool that turns their qualitative view into a living valuation. For example, investors might have optimism about Southern California scarcity value or concern about rent pressure and redevelopment risk. Narratives convert those views into valuations that automatically update when new earnings, news or estimates arrive. These valuations can differ meaningfully, with some investors seeing Rexford’s fair value closer to the most bullish target of around $44, while more cautious users anchor nearer the bearish end around $35.
Do you think there's more to the story for Rexford Industrial Realty? Head over to our Community to see what others are saying!

This article by Simply Wall St is general in nature. We provide commentary based on historical data and analyst forecasts only using an unbiased methodology and our articles are not intended to be financial advice. It does not constitute a recommendation to buy or sell any stock, and does not take account of your objectives, or your financial situation. We aim to bring you long-term focused analysis driven by fundamental data. Note that our analysis may not factor in the latest price-sensitive company announcements or qualitative material. Simply Wall St has no position in any stocks mentioned.
Have feedback on this article? Concerned about the content? Get in touch with us directly. Alternatively, email editorial-team@simplywallst.com