
 Nasdaq
 华尔街日报
华尔街日报Is D-Wave Quantum’s 246.2% Surge Justified by Its Current Valuation Metrics?
- If you are wondering whether D-Wave Quantum's wild share price makes it a genuine opportunity or just hype, you are not alone. More investors are starting to ask whether the current price really reflects the value of its quantum technology ambitions.
- The stock has been on a tear, climbing 15.6% over the last week, 19.1% over the past month, and an eye catching 246.2% over the last year, while its 3 year return sits at a staggering 1675.5%.
- Much of this momentum has been tied to growing excitement around practical quantum computing, partnerships with enterprise customers exploring optimization and AI use cases, and broader investor interest in niche, high risk innovation plays. As headlines continue to highlight breakthroughs and new collaborations in the quantum space, sentiment around D-Wave has become far more speculative, but also more optimistic than in years past.
- Despite that huge run up, D-Wave Quantum currently scores just 0 out of 6 on our valuation checks. This means it fails every metric we use to flag a stock as undervalued. Next, we will unpack what that actually means across different valuation methods and then, at the end of the article, look at an additional way to interpret whether the current price really makes sense.
D-Wave Quantum scores just 0/6 on our valuation checks. See what other red flags we found in the full valuation breakdown.
Approach 1: D-Wave Quantum Discounted Cash Flow (DCF) Analysis
A Discounted Cash Flow, or DCF, model estimates what a company is worth today by projecting its future cash flows and then discounting them back to a present value.
For D-Wave Quantum, the model uses a 2 Stage Free Cash Flow to Equity approach, starting from its latest twelve month free cash flow of around $54.9 Million in the red. Analyst estimates and extrapolations suggest free cash flow could swing positive over time, reaching about $681.98 Million by 2035, with a key milestone of roughly $119.56 Million projected for 2029. These figures reflect expectations that the business will scale sharply as commercial quantum computing adoption improves.
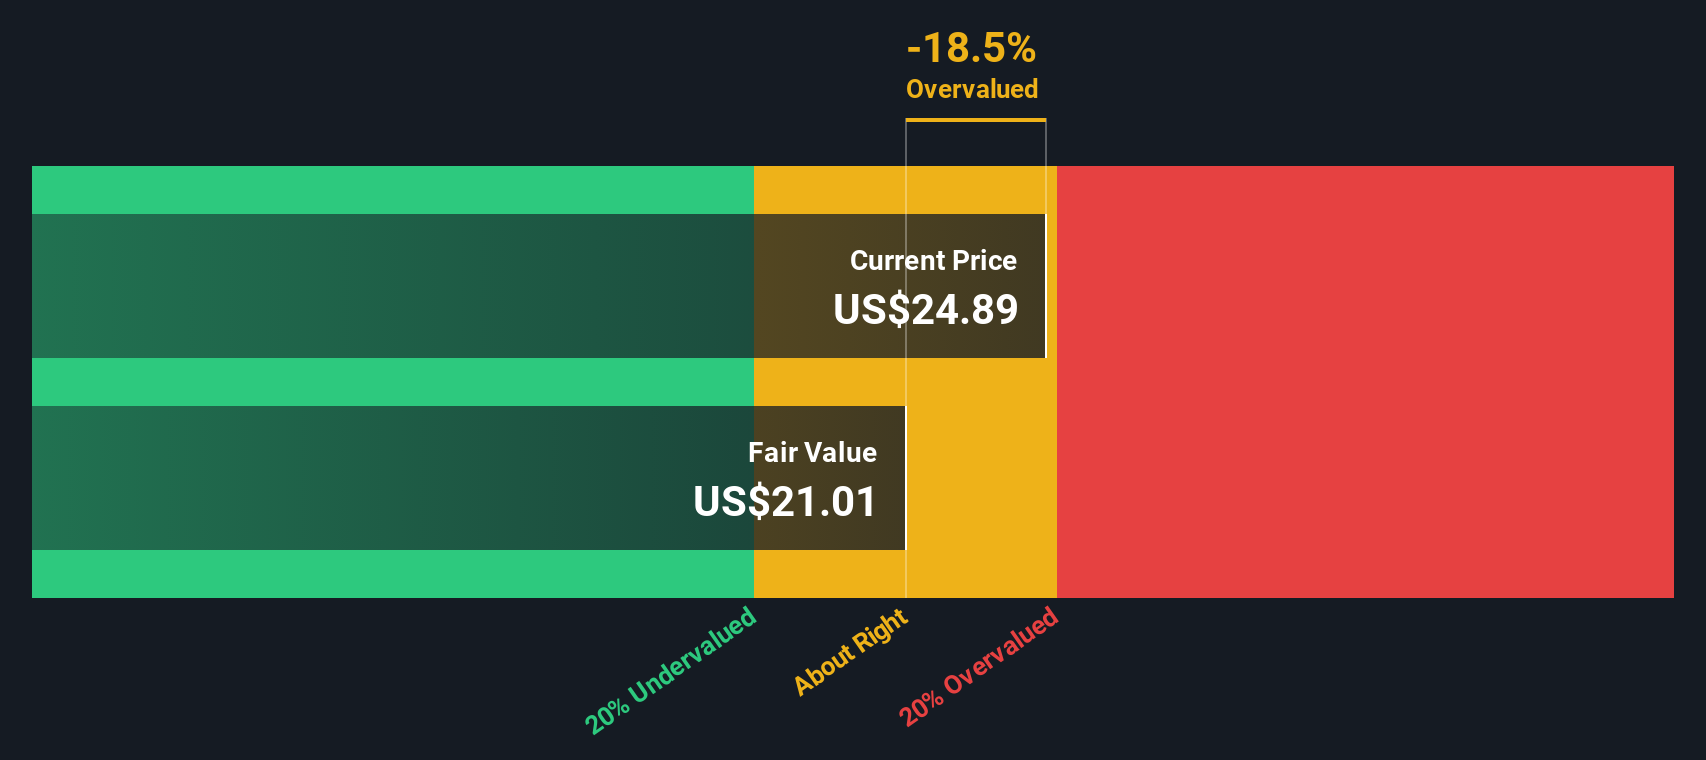
When all these projected $ cash flows are discounted back, Simply Wall St estimates an intrinsic value of about $20.95 per share. Compared with the current share price, that implies D-Wave Quantum is roughly 31.4% overvalued on a DCF basis.
Result: OVERVALUED
Our Discounted Cash Flow (DCF) analysis suggests D-Wave Quantum may be overvalued by 31.4%. Discover 904 undervalued stocks or create your own screener to find better value opportunities.
Approach 2: D-Wave Quantum Price vs Book
For companies that are not yet consistently profitable, the price to book ratio is often a more useful yardstick than earnings based metrics, because it anchors valuation to the net assets backing the business rather than volatile or negative profits.
In general, higher growth and lower risk can justify a richer price to book multiple, while slower growth or higher uncertainty typically warrant a discount. So the question is not just how high D-Wave Quantum's multiple is, but whether that premium is supported by its growth prospects and risk profile.
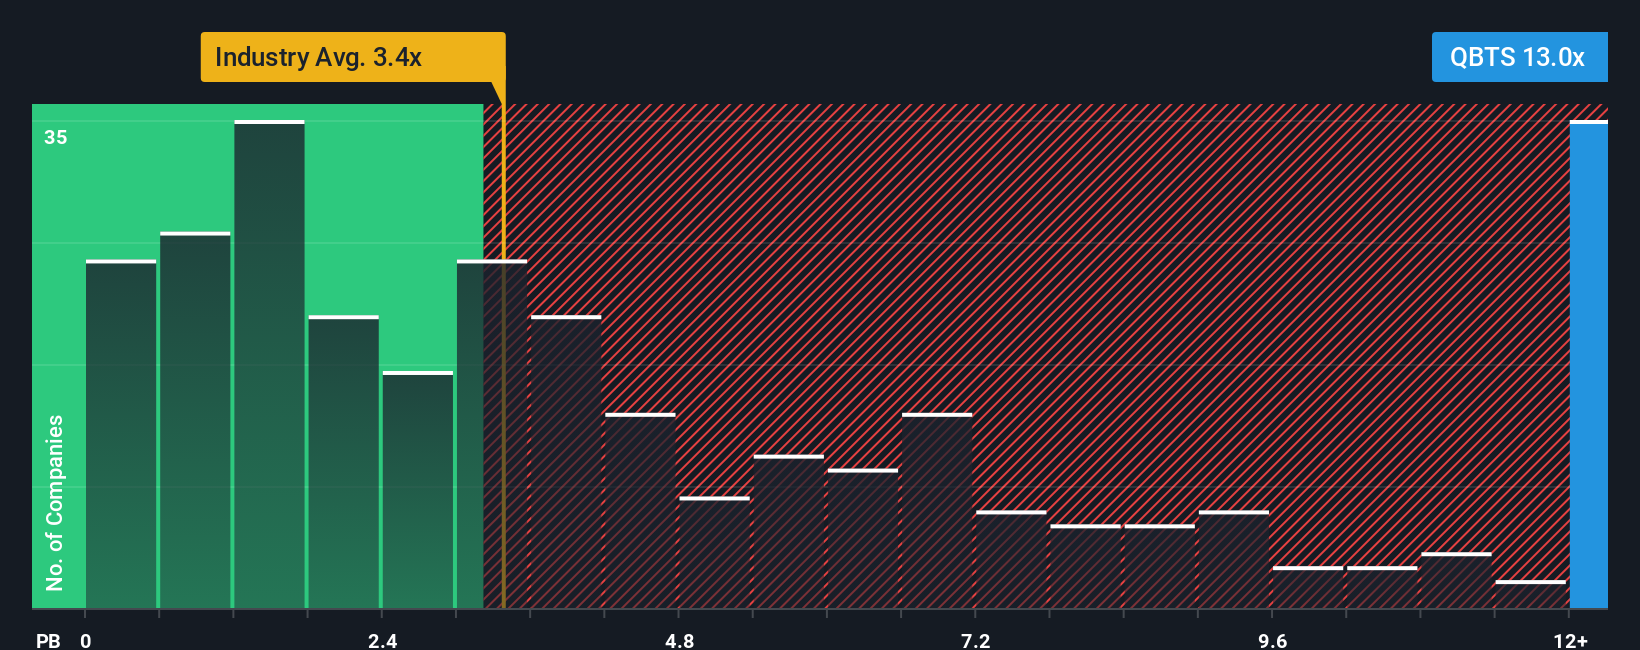
D-Wave Quantum currently trades at about 14.37x book value, well above the broader Software industry average of roughly 3.41x and also higher than its peer group average of around 10.00x. Simply Wall St's Fair Ratio is a proprietary estimate of what a reasonable price to book multiple should be, given the company's growth outlook, profitability, risk factors, industry, and size. Because it adjusts for these fundamentals, the Fair Ratio offers a more tailored benchmark than a simple comparison with peers or the sector. In D-Wave's case, the current multiple sits meaningfully above this Fair Ratio, which suggests the market is pricing in a generous amount of future success.
Result: OVERVALUED
PB ratios tell one story, but what if the real opportunity lies elsewhere? Discover 1460 companies where insiders are betting big on explosive growth.
Upgrade Your Decision Making: Choose your D-Wave Quantum Narrative
Earlier we mentioned that there is an even better way to understand valuation, so let us introduce you to Narratives, a smarter approach that connects the story you believe about a company with the numbers behind it. A Narrative is simply your view of D-Wave Quantum's future, expressed as assumptions for revenue growth, margins, and risk, which then flow into a financial forecast and ultimately a fair value estimate. On Simply Wall St's Community page, used by millions of investors, Narratives let you turn that story into a clear buy, hold, or sell signal by comparing your Fair Value to the current share price. Each Narrative updates dynamically as new information arrives, such as earnings results or major quantum computing announcements, so your view does not go stale. For example, one D-Wave Quantum Narrative might assume rapid enterprise adoption and a high fair value, while another could assume slower commercialization and a far lower fair value, showing how different perspectives can coexist around the same stock.
Do you think there's more to the story for D-Wave Quantum? Head over to our Community to see what others are saying!

This article by Simply Wall St is general in nature. We provide commentary based on historical data and analyst forecasts only using an unbiased methodology and our articles are not intended to be financial advice. It does not constitute a recommendation to buy or sell any stock, and does not take account of your objectives, or your financial situation. We aim to bring you long-term focused analysis driven by fundamental data. Note that our analysis may not factor in the latest price-sensitive company announcements or qualitative material. Simply Wall St has no position in any stocks mentioned.
Have feedback on this article? Concerned about the content? Get in touch with us directly. Alternatively, email editorial-team@simplywallst.com