
 Nasdaq
 华尔街日报
华尔街日报Does Royal Caribbean Still Offer Value After a 521% Three Year Surge?
- Wondering if Royal Caribbean Cruises is still a smart buy after its massive rebound, or if you are late to the party? This breakdown will help you separate real value from the sea of hype.
- The stock has sailed to $294.12, climbing 3.2% over the last week, 15.1% over the last month, 28.4% year to date, and an eye catching 521.4% over three years.
- Those gains have come as investors have leaned into the cruise recovery story, with Royal Caribbean benefiting from surging demand for leisure travel and strong booking trends across new and existing itineraries. The market is essentially repricing the business as a structurally stronger operator, not just a cyclical rebound play.
- Even after that run, our valuation framework gives Royal Caribbean a 5/6 valuation score. In the next sections we will walk through what different valuation methods say about the stock, before finishing with a more complete way to think about its long term value story.
Approach 1: Royal Caribbean Cruises Discounted Cash Flow (DCF) Analysis
A Discounted Cash Flow model estimates what a business is worth today by forecasting the cash it can generate in the future and then discounting those cash flows back to a present value.
For Royal Caribbean Cruises, the model starts with last twelve months Free Cash Flow of about $2.18 billion. Analysts provide detailed forecasts for the next few years, and Simply Wall St then extrapolates those trends further out. Under this 2 stage Free Cash Flow to Equity approach, Free Cash Flow is projected to grow to around $10.23 billion by 2035 as the fleet expands and margins normalise.
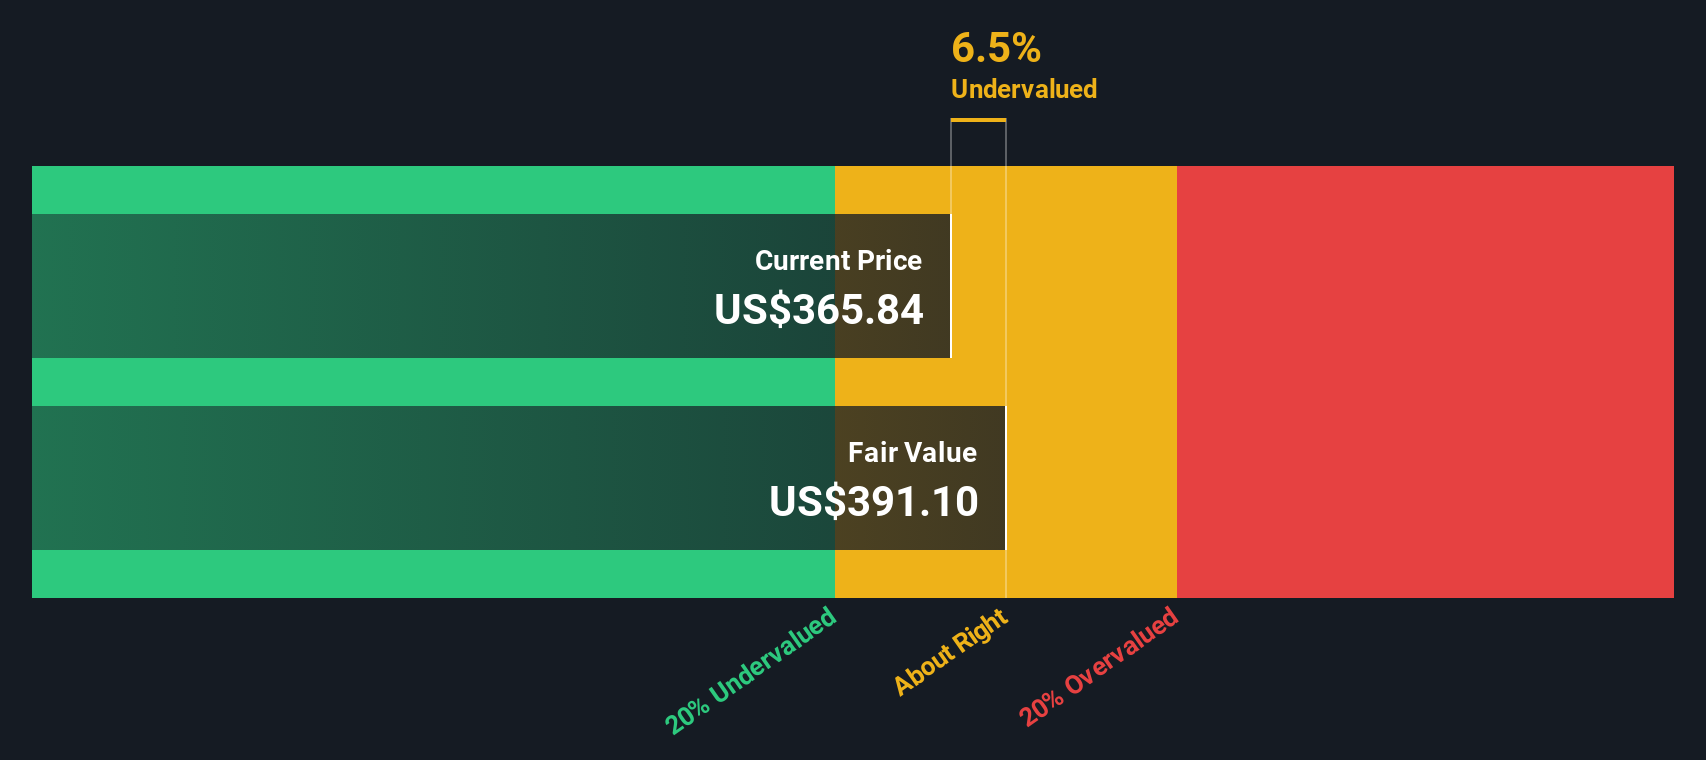
When all of those projected cash flows are discounted back to today, the DCF model suggests an intrinsic value of roughly $429 per share. Compared with the current share price around $294, the stock screens as about 31.5% undervalued on this framework. This suggests the market may not be fully pricing in the long term cash generation profile.
Result: UNDERVALUED
Our Discounted Cash Flow (DCF) analysis suggests Royal Caribbean Cruises is undervalued by 31.5%. Track this in your watchlist or portfolio, or discover 904 more undervalued stocks based on cash flows.
Approach 2: Royal Caribbean Cruises Price vs Earnings
For a profitable company like Royal Caribbean Cruises, the price to earnings, or PE, ratio is a useful way to gauge how much investors are willing to pay for each dollar of current earnings. In broad terms, higher growth and lower perceived risk justify a higher PE, while slower or more volatile earnings usually deserve a lower multiple.
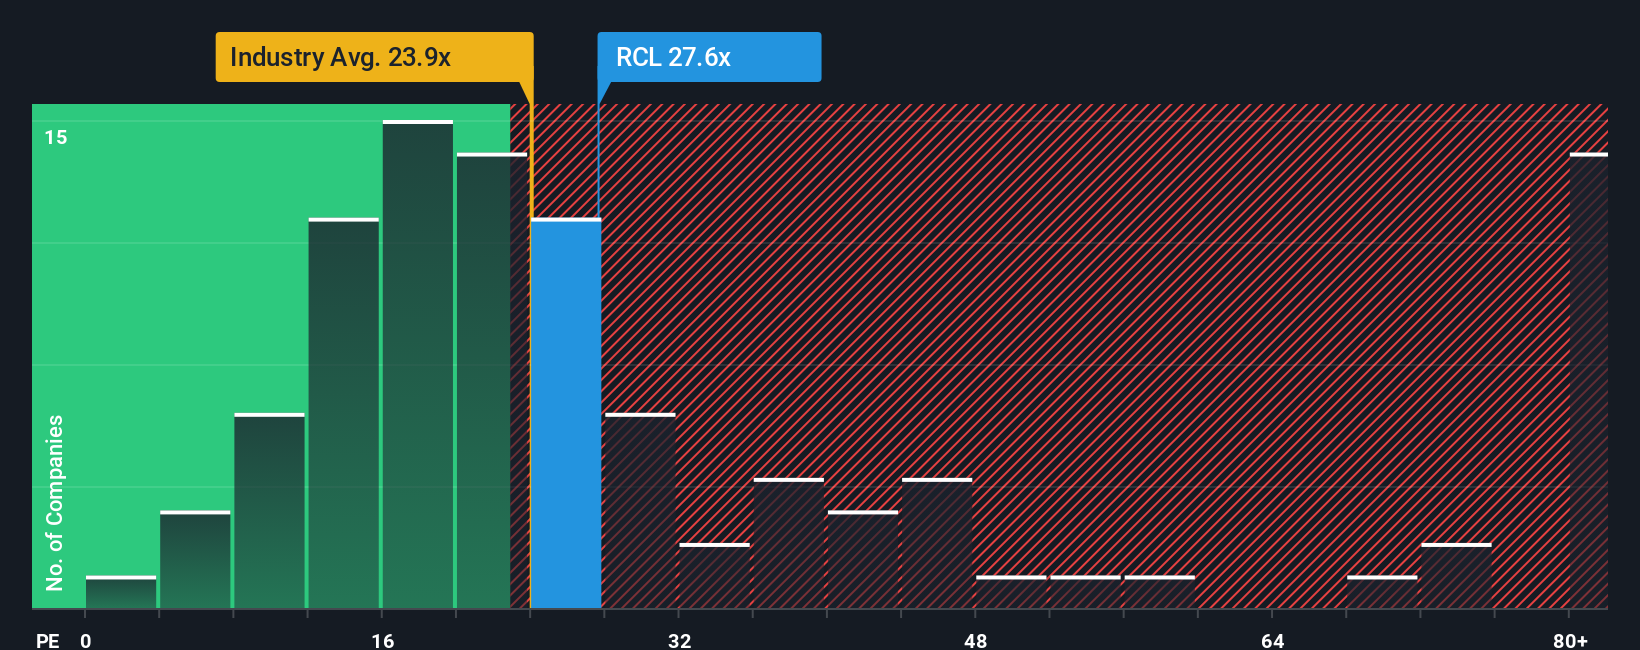
Royal Caribbean currently trades on a PE of about 19.7x, which is below both the Hospitality industry average of roughly 22.0x and the peer average near 28.9x. Simply Wall St goes a step further by estimating a Fair Ratio of around 29.4x, which reflects what the PE might be given the company’s earnings growth outlook, industry, profit margins, size, and risk profile. This Fair Ratio is more informative than a simple industry or peer comparison because it adjusts for Royal Caribbean’s specific fundamentals rather than assuming all cruise and leisure names deserve the same multiple.
With the Fair Ratio sitting meaningfully above the current 19.7x PE, this approach points to the shares trading at a discount to their fundamentals.
Result: UNDERVALUED
PE ratios tell one story, but what if the real opportunity lies elsewhere? Discover 1460 companies where insiders are betting big on explosive growth.
Upgrade Your Decision Making: Choose your Royal Caribbean Cruises Narrative
Earlier we mentioned that there is an even better way to understand valuation. Let us introduce you to Narratives, a simple but powerful tool on Simply Wall St’s Community page that lets you turn your view of Royal Caribbean Cruises into a story backed by numbers. It links your assumptions about future revenue growth, earnings, and margins to a financial forecast, a fair value estimate, and then a clear investment decision based on how that fair value compares with today’s price.
All of this automatically updates as new news or earnings arrive. For example, a bullish investor might build a Narrative that assumes revenue growth in line with the higher analyst expectations, stronger margins, and a fair value near the top end of recent targets around $420. A more cautious investor could assume slower growth, more margin pressure, and a fair value closer to the low end near $218. This gives you a transparent range of possible outcomes and a dynamic way to decide whether you think Royal Caribbean is attractively priced or not.
Do you think there's more to the story for Royal Caribbean Cruises? Head over to our Community to see what others are saying!
This article by Simply Wall St is general in nature. We provide commentary based on historical data and analyst forecasts only using an unbiased methodology and our articles are not intended to be financial advice. It does not constitute a recommendation to buy or sell any stock, and does not take account of your objectives, or your financial situation. We aim to bring you long-term focused analysis driven by fundamental data. Note that our analysis may not factor in the latest price-sensitive company announcements or qualitative material. Simply Wall St has no position in any stocks mentioned.
Have feedback on this article? Concerned about the content? Get in touch with us directly. Alternatively, email editorial-team@simplywallst.com