
 Nasdaq
 华尔街日报
华尔街日报Is Exor’s 18.5% Share Price Slide in 2025 an Opportunity for Investors?
- If you are wondering whether Exor is a bargain hiding in plain sight, you are not alone. This stock has been drawing interest from investors who like to dig beneath the surface of holding companies.
- Despite a recent 0.9% gain over the last week and a modest 2.0% move over the past month, the share price is still down 18.5% year to date and 17.2% over the last year. This naturally raises the question of whether the market has become too pessimistic.
- Much of the recent conversation around Exor has centered on its ongoing portfolio reshaping, including adjustments to its stakes in key holdings and a renewed focus on capital allocation discipline. Moves like these often take time to be fully reflected in the share price. Investors have also been watching management’s comments on strategic flexibility and potential new investments, which can shift how the market thinks about both risk and potential upside.
- Our framework gives Exor a valuation score of 5/6, suggesting that on most of our checks the shares look undervalued. In the next sections we will break down how different valuation approaches arrive at that conclusion and why there might be an even smarter way to think about value by the end of this article.
Find out why Exor's -17.2% return over the last year is lagging behind its peers.
Approach 1: Exor Excess Returns Analysis
The Excess Returns model looks at how much value a company creates above the return that shareholders demand, then capitalises those extra profits into an intrinsic value per share.
For Exor, the starting point is a Book Value of €180.42 per share and a Stable EPS of €20.76 per share, based on the median return on equity over the past five years. That implies an Average Return on Equity of 19.51%, which is comfortably higher than the implied Cost of Equity of about €6.30 per share.
The difference between what Exor earns and what investors require shows up as an Excess Return of €14.46 per share. Using a Stable Book Value of €106.38 per share as the long run capital base, the model estimates the intrinsic value of Exor at roughly €457 per share.
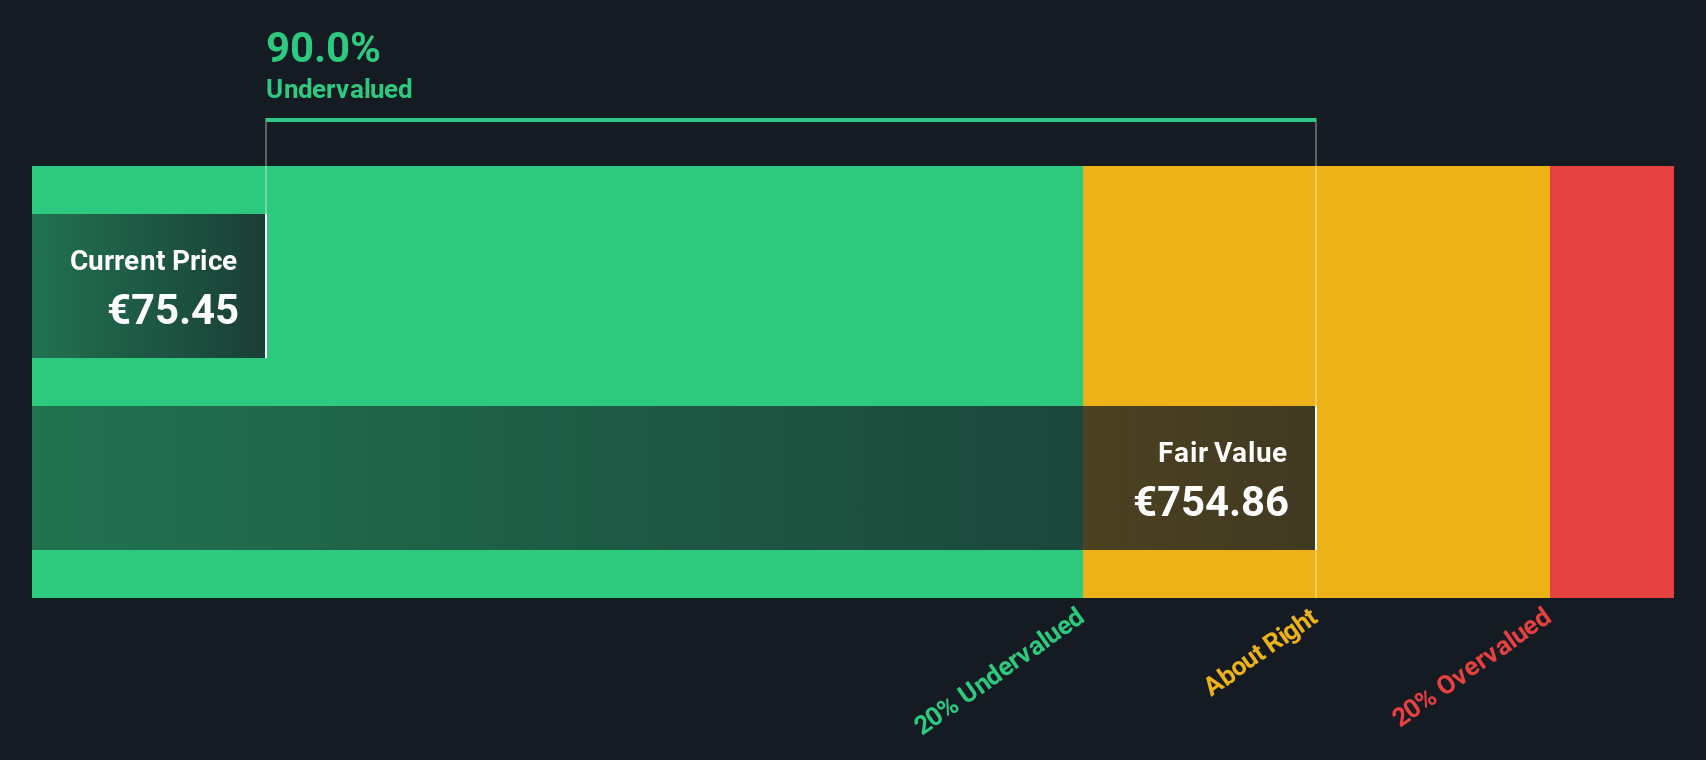
Compared with the current share price, this output is interpreted in the model as indicating the stock is about 84.2% undervalued, suggesting that the market is heavily discounting Exor relative to the returns it is generating on its equity base.
Result: UNDERVALUED (model-based)
Our Excess Returns analysis suggests Exor is undervalued by 84.2%. Track this in your watchlist or portfolio, or discover 904 more undervalued stocks based on cash flows.
Approach 2: Exor Price vs Book
For asset heavy, diversified financial groups like Exor, the price to book ratio is often the cleanest way to judge value. It compares what you pay in the market with the net assets you effectively own on the balance sheet.
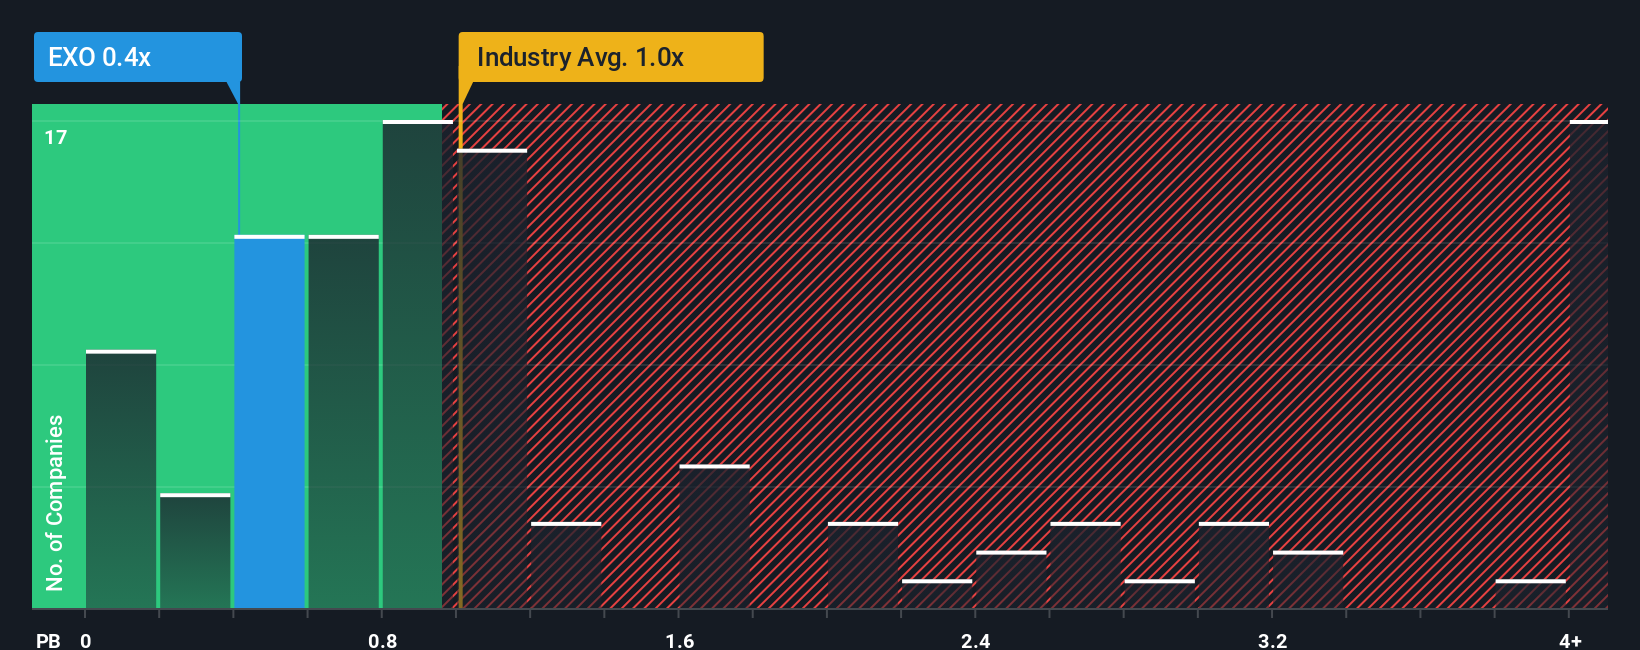
In general, a higher price to book multiple is justified when investors expect stronger growth, superior capital allocation or lower risk. Businesses with shakier prospects or more volatile earnings usually trade closer to, or even below, their book value. Against that backdrop, Exor currently trades at around 0.41x book value, which is not only below the broader Diversified Financial industry average of about 1.14x, but also far beneath the 6.16x average for its peer group, signalling that the market is placing a steep discount on its asset base.
Simply Wall St also uses a proprietary Fair Ratio, which estimates what Exor’s price to book multiple should be once you factor in its growth profile, risk characteristics, profitability, industry positioning and market cap. This makes it a more tailored benchmark than simple peer or industry comparisons. With the actual 0.41x multiple sitting well below this model implied Fair Ratio, the shares appear to be trading at an attractive discount on this measure too.
Result: UNDERVALUED
PB ratios tell one story, but what if the real opportunity lies elsewhere? Discover 1460 companies where insiders are betting big on explosive growth.
Upgrade Your Decision Making: Choose your Exor Narrative
Earlier we mentioned that there is an even better way to understand valuation, so let us introduce you to Narratives, a simple way to connect your view of a company with the numbers behind it. A Narrative is your story about Exor, where you spell out how you think its revenues, earnings and margins will develop, and then tie that view to a clear fair value estimate. Instead of treating forecasts as abstract figures, Narratives link Exor’s business drivers to a financial model and then directly to what you believe the shares are worth. On Simply Wall St’s Community page, used by millions of investors, you can easily build or explore Narratives and then compare each Narrative’s Fair Value to the current Price to help with your investment decisions. These Narratives update dynamically when fresh information arrives, such as earnings releases or major news, so your view can evolve as the story does. For example, one Exor Narrative may assume strong compounding and a high fair value, while another bakes in slower growth and a much lower fair value.
Do you think there's more to the story for Exor? Head over to our Community to see what others are saying!

This article by Simply Wall St is general in nature. We provide commentary based on historical data and analyst forecasts only using an unbiased methodology and our articles are not intended to be financial advice. It does not constitute a recommendation to buy or sell any stock, and does not take account of your objectives, or your financial situation. We aim to bring you long-term focused analysis driven by fundamental data. Note that our analysis may not factor in the latest price-sensitive company announcements or qualitative material. Simply Wall St has no position in any stocks mentioned.
Have feedback on this article? Concerned about the content? Get in touch with us directly. Alternatively, email editorial-team@simplywallst.com