
 Nasdaq
 华尔街日报
华尔街日报Is Solaris Energy Infrastructure’s Huge Multi Year Rally Still Supported by Fundamentals in 2025?
- If you are wondering whether Solaris Energy Infrastructure is still worth buying after such a strong run, you are not alone. That is exactly what this breakdown is going to tackle in plain language.
- The stock has climbed 10.9% over the past week and is up 53.0% year to date, on top of a striking 59.4% gain over the last year and a 424.2% return over three years and 565.1% over five years. This naturally raises questions about how much upside is left versus the risk of a pullback.
- Those moves have come as investors have refocused on energy transition infrastructure, with Solaris frequently mentioned alongside peers in analyst roundups that highlight long-life contracted assets and growing demand for grid upgrades. Coverage has also pointed to large-scale capital spending plans across the sector, which helps explain why sentiment has shifted toward growth rather than just income.
- Despite the rally, Solaris currently posts a valuation score of 3 out of 6, suggesting it still screens as undervalued on several key metrics. In the sections that follow, we will unpack those traditional valuation approaches while also hinting at a more holistic way to judge fair value that we will come back to at the end.
Approach 1: Solaris Energy Infrastructure Discounted Cash Flow (DCF) Analysis
A Discounted Cash Flow model estimates what a company is worth by projecting the cash it could generate in the future and then discounting those cash flows back to today in dollar terms.
For Solaris Energy Infrastructure, the latest twelve month free cash flow is negative at about $191.0 million, reflecting heavy investment and build out. Analyst projections and subsequent extrapolations indicate this could move into positive territory, with free cash flow projected to reach roughly $3.3 billion by 2035 as new assets start contributing.
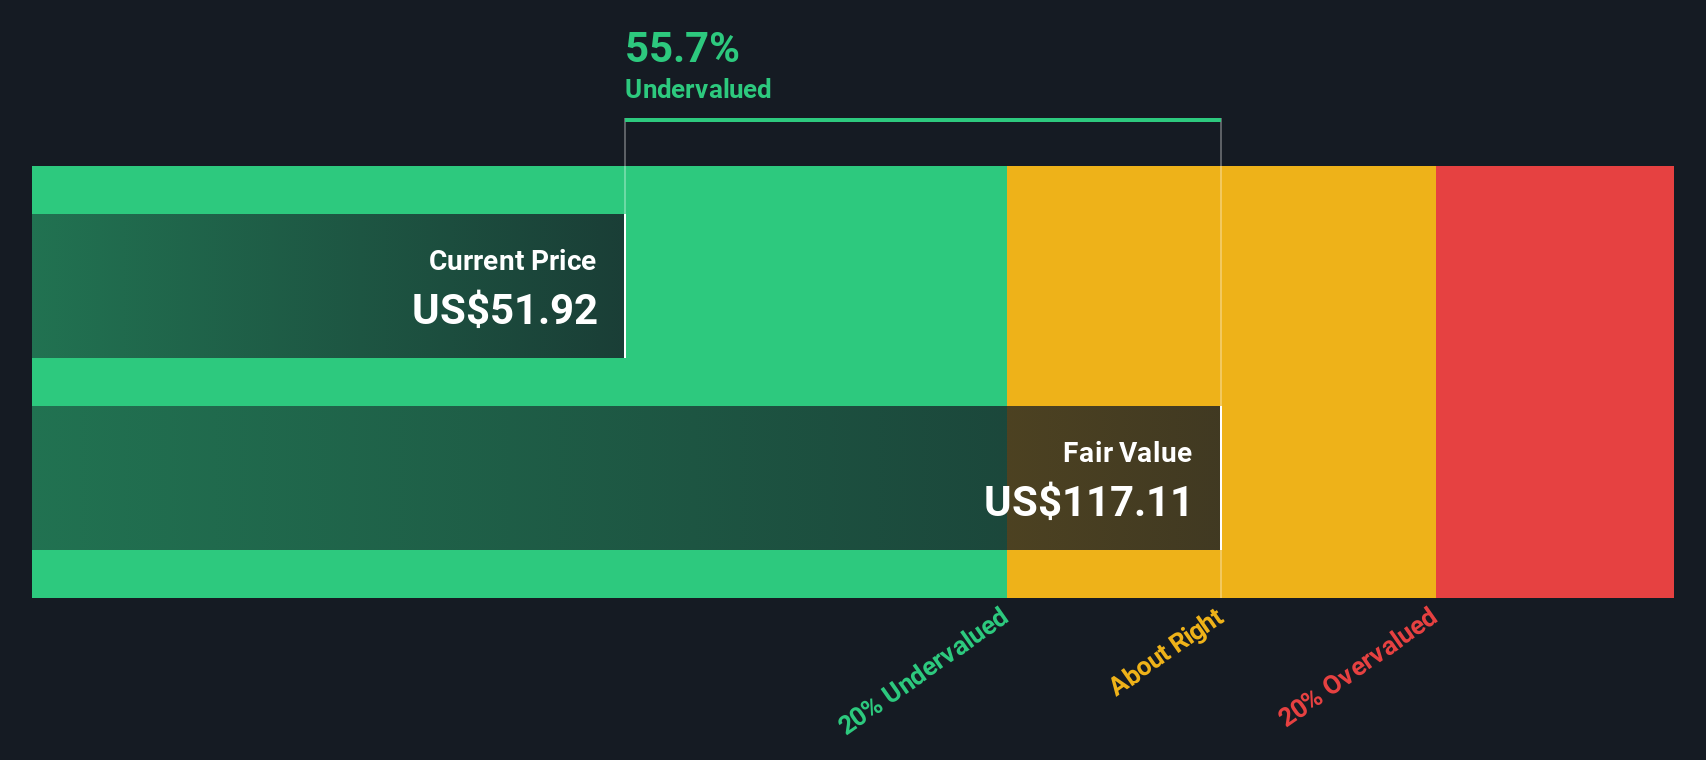
Simply Wall St uses a 2 Stage Free Cash Flow to Equity model, which combines these early years of ramp up with longer term, more stable growth assumptions. When all those future cash flows are discounted back, the estimated intrinsic value is about $734.40 per share.
Compared with the current share price, the model indicates Solaris is trading at a 93.9% discount to its calculated fair value. This suggests the market may still be materially underpricing its long term cash generation potential.
Result: UNDERVALUED
Our Discounted Cash Flow (DCF) analysis suggests Solaris Energy Infrastructure is undervalued by 93.9%. Track this in your watchlist or portfolio, or discover 904 more undervalued stocks based on cash flows.
Approach 2: Solaris Energy Infrastructure Price vs Earnings
For a profitable business like Solaris, the Price to Earnings, or PE, ratio is a useful reality check, because it links what investors are paying directly to the earnings the company is already generating. In general, faster growing and lower risk companies deserve a higher PE, while slower growing or riskier businesses typically trade on lower multiples.
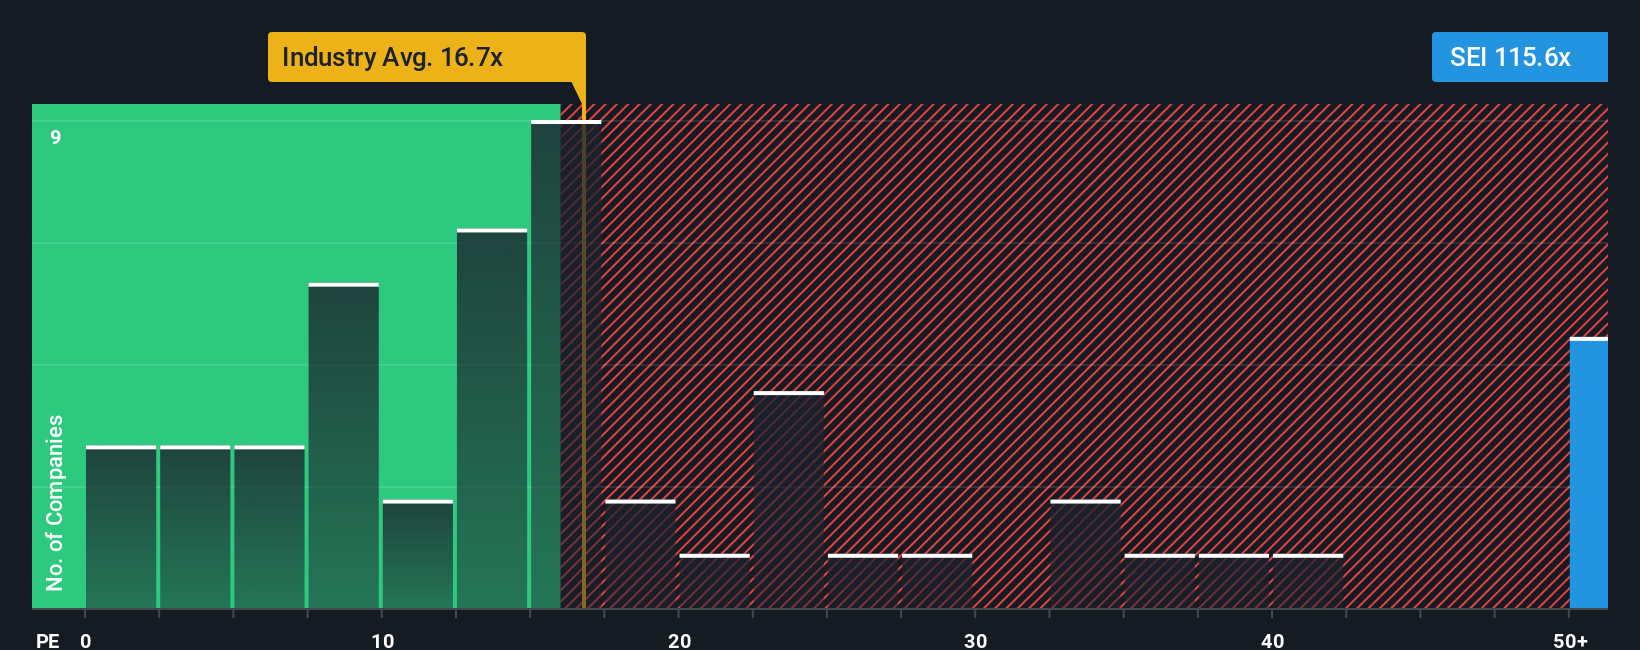
Solaris currently trades on a PE of about 60.5x, which is well above the broader Energy Services industry average of roughly 18.1x and also higher than the peer group average of around 25.1x. On the surface, that premium suggests investors are already paying up for Solaris earnings relative to its sector.
Simply Wall St also calculates a Fair Ratio, which is the PE you would reasonably expect for Solaris given its specific mix of earnings growth, profit margins, industry, market cap and risk profile. For Solaris, that Fair Ratio is estimated at about 25.3x, meaning the stock is trading notably richer than what those fundamentals alone would justify. Because this company specific benchmark bakes in growth and risk rather than just comparing raw multiples, it provides a more tailored view, and on that basis Solaris screens as overvalued on earnings.
Result: OVERVALUED
PE ratios tell one story, but what if the real opportunity lies elsewhere? Discover 1460 companies where insiders are betting big on explosive growth.
Upgrade Your Decision Making: Choose your Solaris Energy Infrastructure Narrative
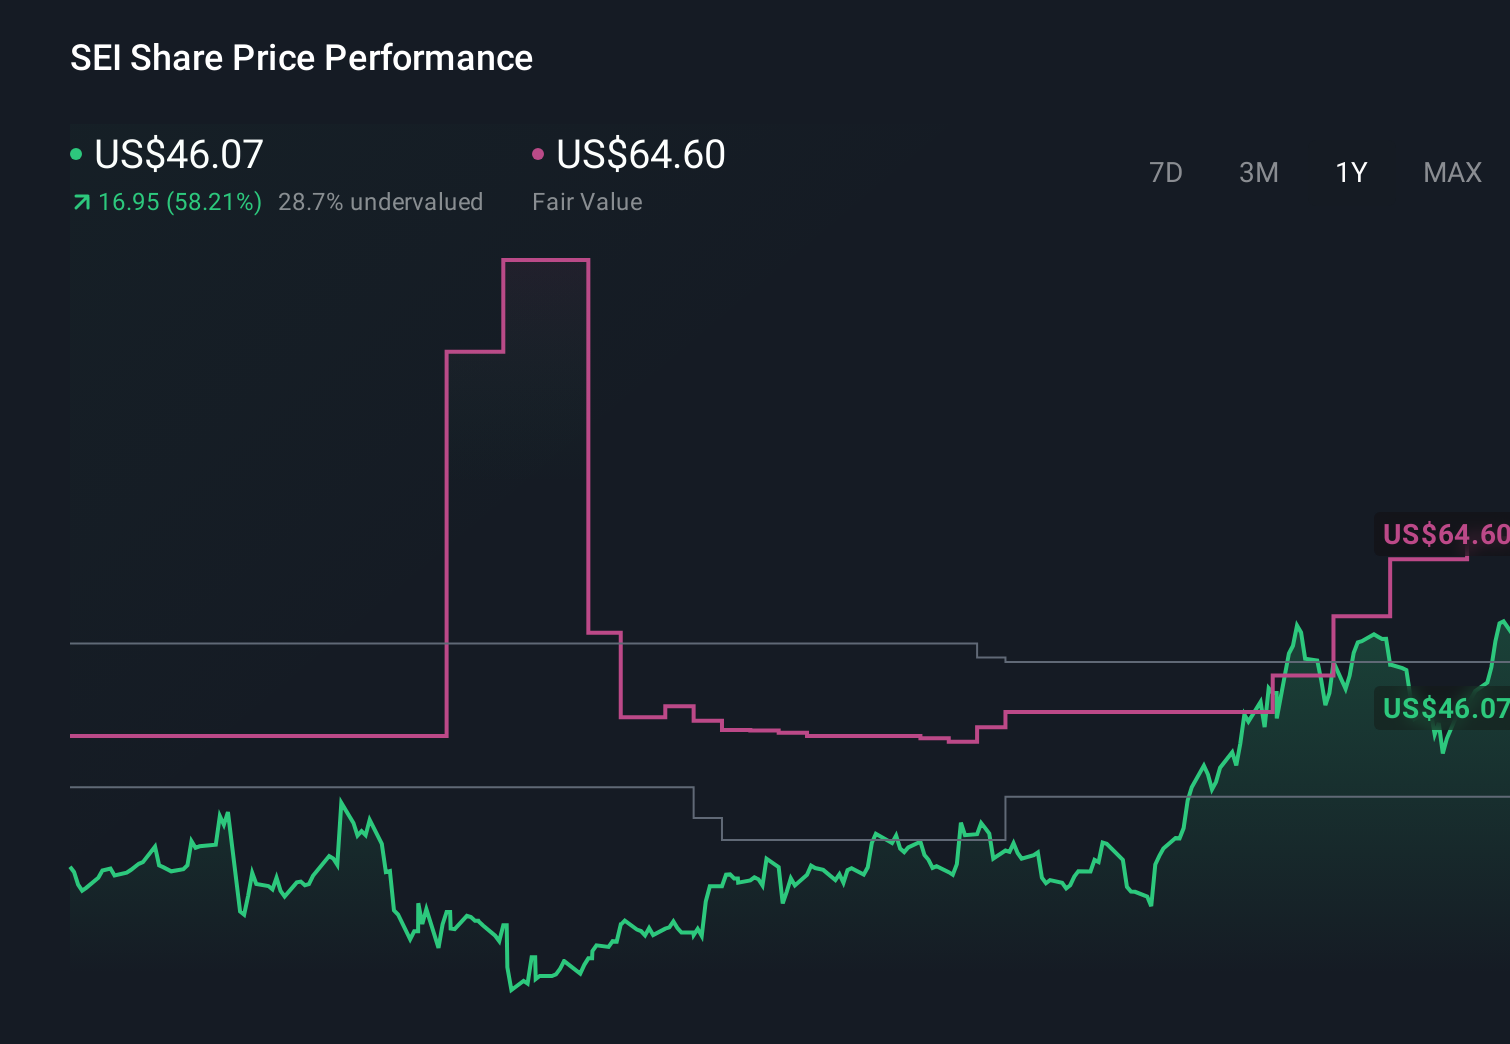
Earlier we mentioned that there is an even better way to understand valuation, so let us introduce you to Narratives, a simple tool on Simply Wall St’s Community page where you connect your view of Solaris Energy Infrastructure’s story to a set of numbers by choosing assumptions for future revenue, earnings and margins. These then flow into a forecast and a fair value estimate that you can easily compare with today’s share price to decide if Solaris looks buyable or stretched. Your Narrative stays current because it updates as new news or earnings arrive. Different investors can transparently express very different perspectives. For example, there might be a more optimistic Narrative that assumes Solaris successfully monetises its growing 2.2GW capacity, lands additional data center contracts and deserves something closer to the recent fair value estimate of about $64.60 per share. In contrast, a more cautious Narrative might lean toward the lower analyst target of $38.00, perhaps assuming tougher competition and slower contract wins.
Do you think there's more to the story for Solaris Energy Infrastructure? Head over to our Community to see what others are saying!
This article by Simply Wall St is general in nature. We provide commentary based on historical data and analyst forecasts only using an unbiased methodology and our articles are not intended to be financial advice. It does not constitute a recommendation to buy or sell any stock, and does not take account of your objectives, or your financial situation. We aim to bring you long-term focused analysis driven by fundamental data. Note that our analysis may not factor in the latest price-sensitive company announcements or qualitative material. Simply Wall St has no position in any stocks mentioned.
Have feedback on this article? Concerned about the content? Get in touch with us directly. Alternatively, email editorial-team@simplywallst.com