
 Nasdaq
 华尔街日报
华尔街日报Realty Income (O): Revisiting Valuation After a Steady Share Price Climb
Realty Income (O) has quietly ground out dependable gains this year, and the stock’s recent move higher has investors revisiting a simple question: is this monthly dividend machine still reasonably priced?
See our latest analysis for Realty Income.
At around $56.67, the recent uptick in Realty Income’s share price caps a steadier year to date, with solid year to date share price gains and a respectable one year total shareholder return suggesting momentum is slowly rebuilding as income focused investors reassess rate risks and long term growth.
If steady dividends are your anchor but you also want more growth on the side, this could be a good moment to explore fast growing stocks with high insider ownership.
With analysts still seeing upside to fair value and Realty Income trading at a hefty intrinsic discount, investors face a key question: is this dependable REIT a mispriced income gem, or has the market already baked in its next leg of growth?
Most Popular Narrative: 7.5% Undervalued
With Realty Income last closing at $56.67 against a narrative fair value near the low $60s, the valuation debate centers firmly on its dividend power.
Given the expectation that Realty Income’s dividend growth will decelerate in the coming years, greater weight will be assigned to the Dividend Discount Model. This model reflects more appropriately the anticipated slowdown in dividend growth. In contrast, the Historical Yield method assumes mean reversion, which introduces a higher degree of uncertainty, and so it will have a lower weight on the valuation.
Curious how steady inflation level dividend growth, a conservative discount rate, and a premium earnings multiple still point to upside? The underlying math may surprise you.
Result: Fair Value of $61.26 (UNDERVALUED)
Have a read of the narrative in full and understand what's behind the forecasts.
However, slower dividend growth or a sharper than expected rise in long term rates could compress Realty Income’s valuation and challenge the current upside case.
Find out about the key risks to this Realty Income narrative.
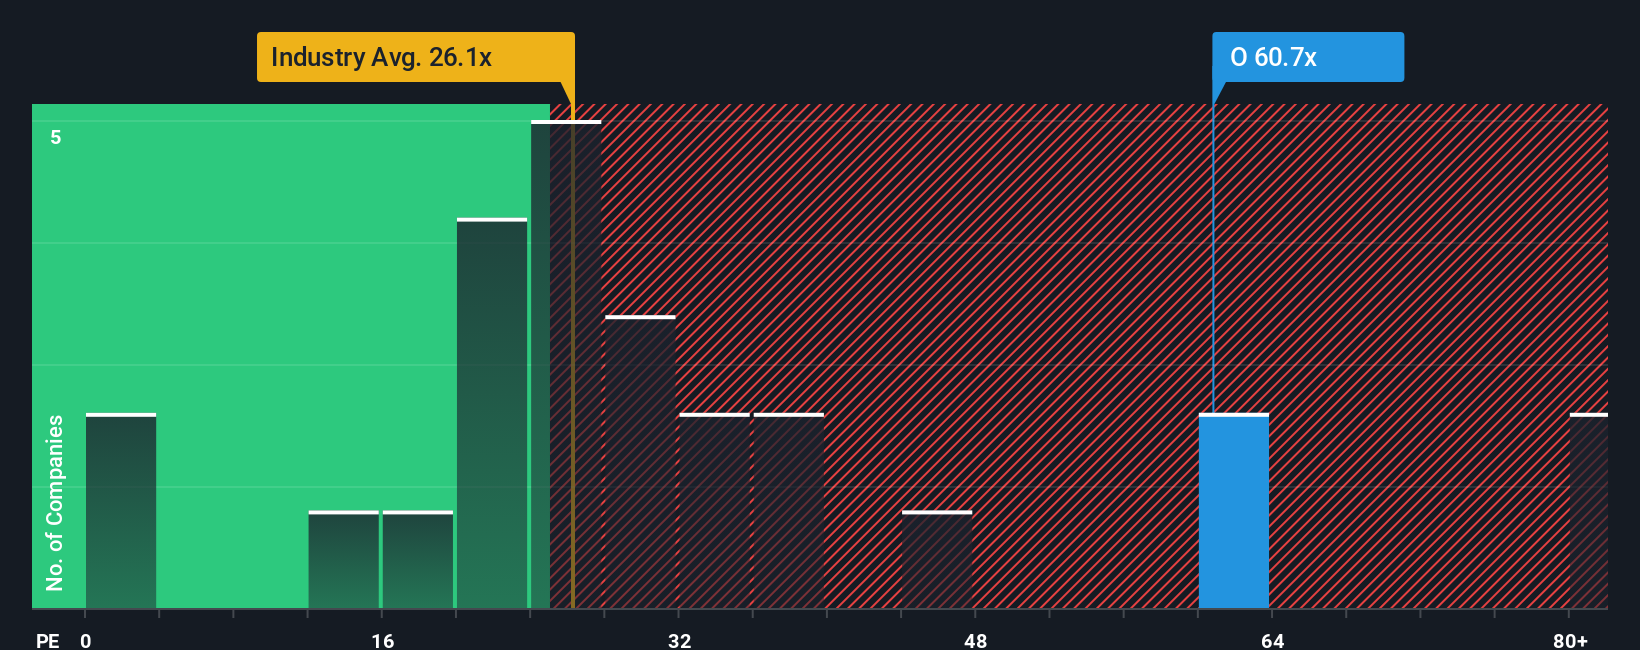
Another View: Rich On Earnings Metrics
Flip the lens to earnings and the story feels less forgiving. At about 54 times earnings versus a fair ratio closer to 35, and well above both the Retail REITs average of 27 times and peer average near 32 times, the stock screens expensive. This raises the risk of a valuation squeeze if sentiment cools.
See what the numbers say about this price — find out in our valuation breakdown.
Build Your Own Realty Income Narrative
If this take does not quite match your view, or you would rather lean on your own analysis, you can build a personalized thesis in just a few minutes, starting with Do it your way.
A great starting point for your Realty Income research is our analysis highlighting 4 key rewards and 2 important warning signs that could impact your investment decision.
Looking for more high conviction investment ideas?
Before you move on, lock in an edge by scanning fresh opportunities on Simply Wall Street, so the next wave of winners does not pass you by.
- Capitalize on mispriced quality by targeting companies trading below their cash flow value through these 905 undervalued stocks based on cash flows that could offer stronger long term upside.
- Ride powerful secular trends by focusing on innovation leaders using these 24 AI penny stocks that may reshape entire industries and revenue models.
- Strengthen your income strategy by prioritizing reliable payouts via these 10 dividend stocks with yields > 3% that can enhance total returns while supporting portfolio stability.
This article by Simply Wall St is general in nature. We provide commentary based on historical data and analyst forecasts only using an unbiased methodology and our articles are not intended to be financial advice. It does not constitute a recommendation to buy or sell any stock, and does not take account of your objectives, or your financial situation. We aim to bring you long-term focused analysis driven by fundamental data. Note that our analysis may not factor in the latest price-sensitive company announcements or qualitative material. Simply Wall St has no position in any stocks mentioned.
Have feedback on this article? Concerned about the content? Get in touch with us directly. Alternatively, email editorial-team@simplywallst.com