
 Nasdaq
 华尔街日报
华尔街日报Does Novo Nordisk’s Recent Share Rebound Match Its Long Term Valuation Potential in 2025?
- If you are wondering whether Novo Nordisk’s stellar reputation is already fully priced into the stock, you are not alone. This article is going to unpack exactly how much real value is baked into today’s share price.
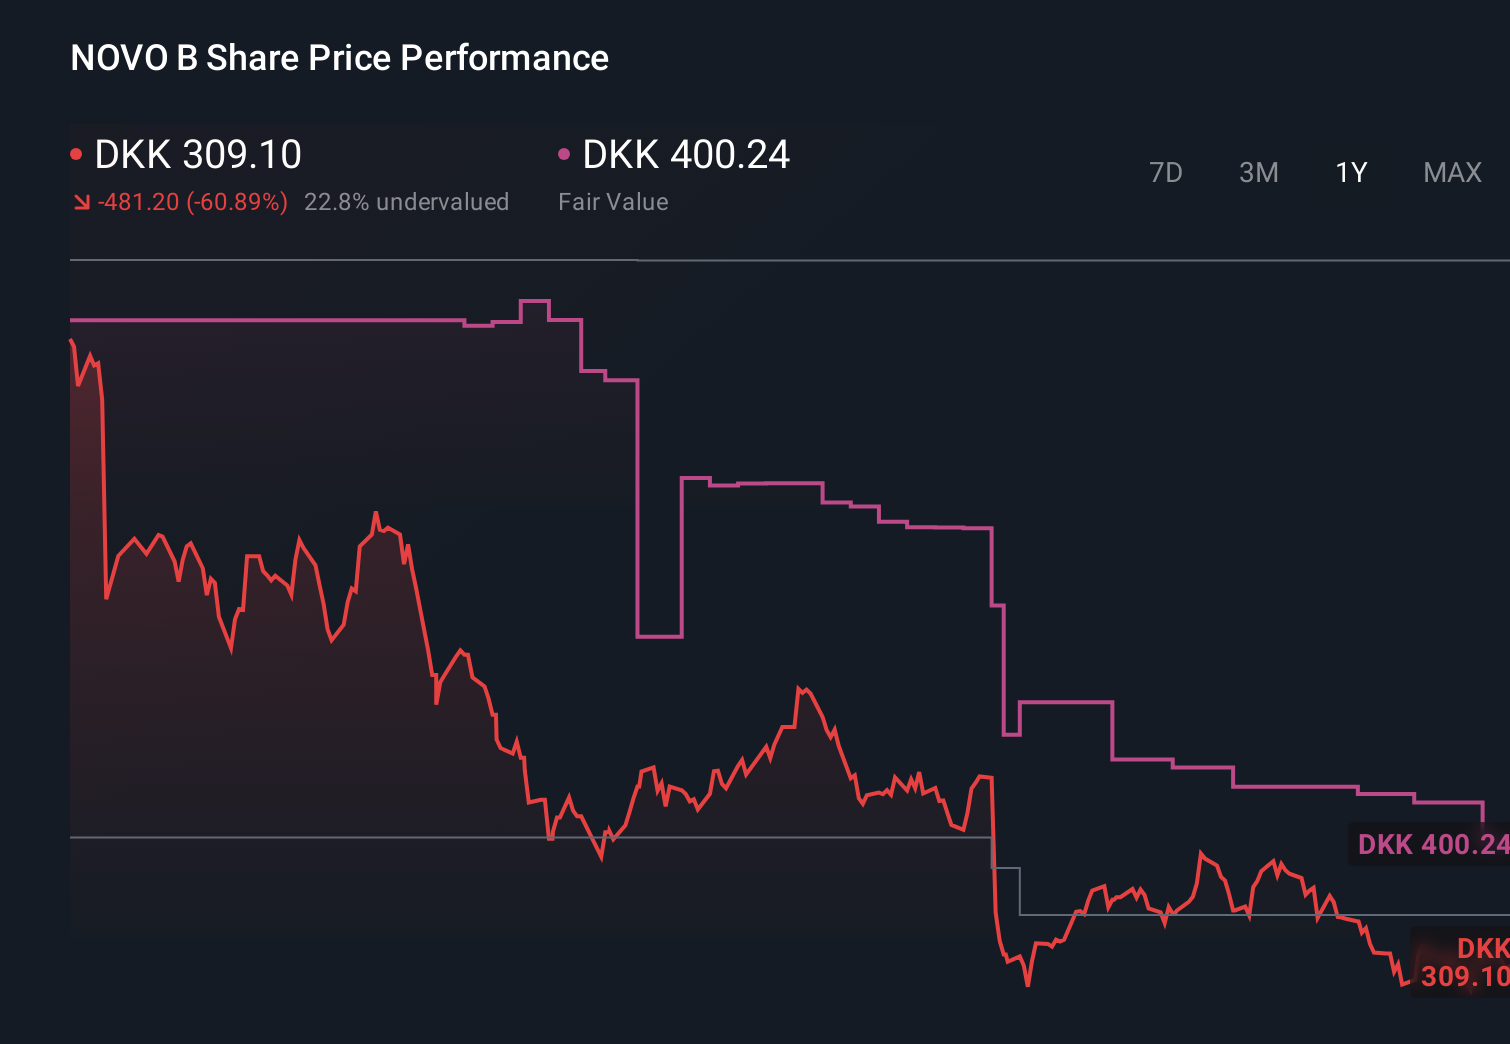
- Despite a choppy longer term track record with the stock down 45.2% over the last year, recent momentum has picked up, with shares gaining 7.2% in the past week and 8.8% over the last month from a recent close of DKK 331.55.
- Part of this swing in sentiment reflects ongoing optimism around Novo Nordisk’s leadership in diabetes and obesity treatments, including continued strong demand for its GLP 1 based drugs that dominate a rapidly expanding market. At the same time, investors are weighing regulatory scrutiny and competitive pipelines from big pharma rivals, which adds nuance to how much future growth should be priced in today.
- On our framework, Novo Nordisk scores a 5/6 valuation check. This suggests it screens as undervalued on most, but not all, traditional measures. Next we will walk through those standard valuation lenses, before finishing with a more powerful way to think about what this business could really be worth.
Find out why Novo Nordisk's -45.2% return over the last year is lagging behind its peers.
Approach 1: Novo Nordisk Discounted Cash Flow (DCF) Analysis
A Discounted Cash Flow model projects the cash a business is expected to generate in the future and then discounts those amounts back to today to estimate what the company is really worth now.
Novo Nordisk currently produces about DKK 67.6 billion in free cash flow. Analyst forecasts, extended by Simply Wall St’s 2 Stage Free Cash Flow to Equity model, project this to rise to roughly DKK 199.0 billion by 2035. Over the next decade, annual free cash flow is expected to climb steadily, with key projection years such as 2029 and 2030 reaching about DKK 125.8 billion and DKK 144.1 billion respectively, before moderating to slower growth as the business matures.
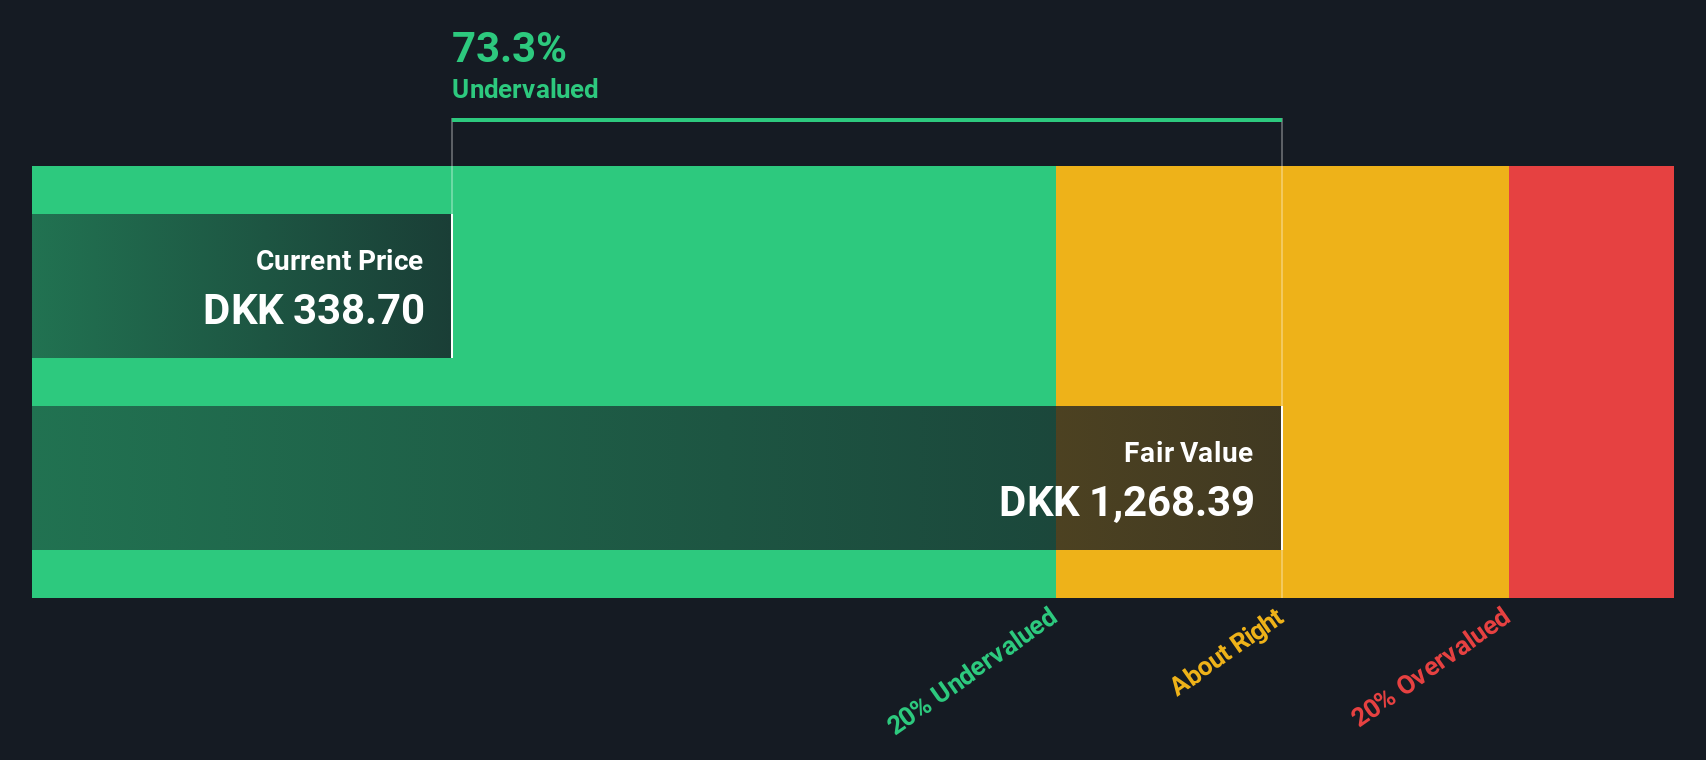
When these future cash flows are discounted back to today, the model estimates an intrinsic value of about DKK 1,060.61 per share. Compared with the recent share price around DKK 331.55, the DCF indicates the stock trades at a 68.7% discount to its estimated fair value, suggesting substantial potential upside if these projections occur as expected.
Result: UNDERVALUED
Our Discounted Cash Flow (DCF) analysis suggests Novo Nordisk is undervalued by 68.7%. Track this in your watchlist or portfolio, or discover 905 more undervalued stocks based on cash flows.
Approach 2: Novo Nordisk Price vs Earnings
For profitable businesses like Novo Nordisk, the price to earnings ratio is often the most intuitive yardstick because it links what investors pay today to the actual earnings the business is generating. In general, higher growth and lower risk justify a higher normal PE ratio, while slower growth or higher uncertainty usually demand a lower one.
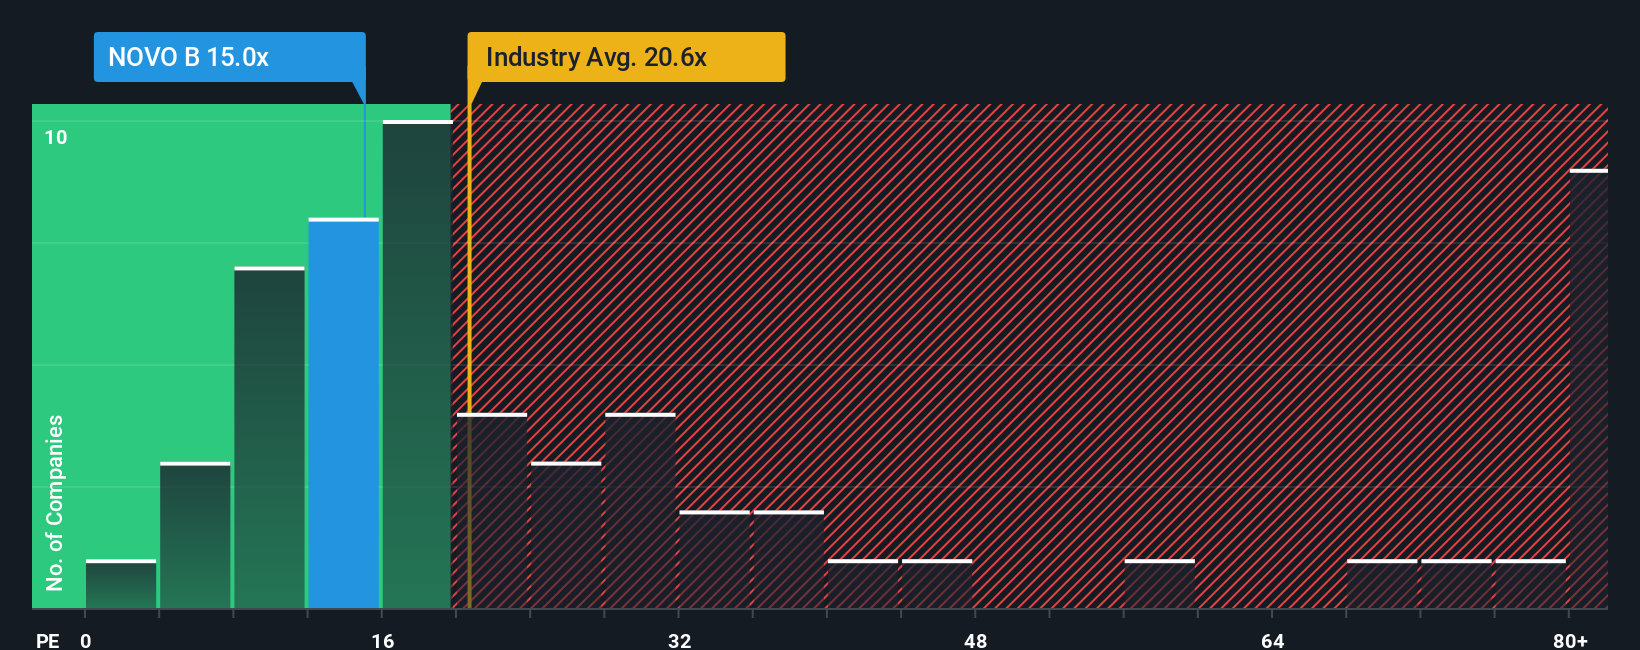
Novo Nordisk currently trades on a PE of about 14.20x. That sits well below both the Pharmaceuticals industry average of roughly 22.60x and the peer group average near 26.52x, which at first glance makes the shares look inexpensive relative to the sector. However, Simply Wall St goes a step further by estimating a Fair Ratio of 26.10x, which is the PE multiple you might expect given Novo Nordisk’s earnings growth outlook, profitability, size, industry and risk profile.
This Fair Ratio is more informative than simple peer or industry comparisons because it adjusts for the company’s specific strengths and risks rather than assuming all drug makers should trade on similar multiples. With the current PE of 14.20x sitting well below the Fair Ratio of 26.10x, this approach also points to Novo Nordisk being undervalued on an earnings basis.
Result: UNDERVALUED
PE ratios tell one story, but what if the real opportunity lies elsewhere? Discover 1459 companies where insiders are betting big on explosive growth.
Upgrade Your Decision Making: Choose your Novo Nordisk Narrative
Earlier we mentioned that there is an even better way to understand valuation, so let us introduce you to Narratives. This is a simple framework on Simply Wall St’s Community page where you describe your story for a company, translate that story into assumptions about future revenue, earnings and margins, and then see the fair value those assumptions imply. You can compare this with today’s share price, monitor when new information updates the numbers automatically, and understand why, for example, one Novo Nordisk investor might assume rapid GLP 1 driven growth and arrive at a fair value near DKK 1,036 per share, while another bakes in slower growth and competitive pressure to land closer to DKK 393. This gives you a clear, dynamic map of who thinks the stock is cheap, who thinks it is expensive, and what would have to change for you to buy, hold or sell.
Do you think there's more to the story for Novo Nordisk? Head over to our Community to see what others are saying!
This article by Simply Wall St is general in nature. We provide commentary based on historical data and analyst forecasts only using an unbiased methodology and our articles are not intended to be financial advice. It does not constitute a recommendation to buy or sell any stock, and does not take account of your objectives, or your financial situation. We aim to bring you long-term focused analysis driven by fundamental data. Note that our analysis may not factor in the latest price-sensitive company announcements or qualitative material. Simply Wall St has no position in any stocks mentioned.
Have feedback on this article? Concerned about the content? Get in touch with us directly. Alternatively, email editorial-team@simplywallst.com