
 Nasdaq
 华尔街日报
华尔街日报Retail investors among Kreate Group Oyj's (HEL:KREATE) largest shareholders, saw gain in holdings value after stock jumped 12% last week
Key Insights
- The considerable ownership by retail investors in Kreate Group Oyj indicates that they collectively have a greater say in management and business strategy
- A total of 7 investors have a majority stake in the company with 52% ownership
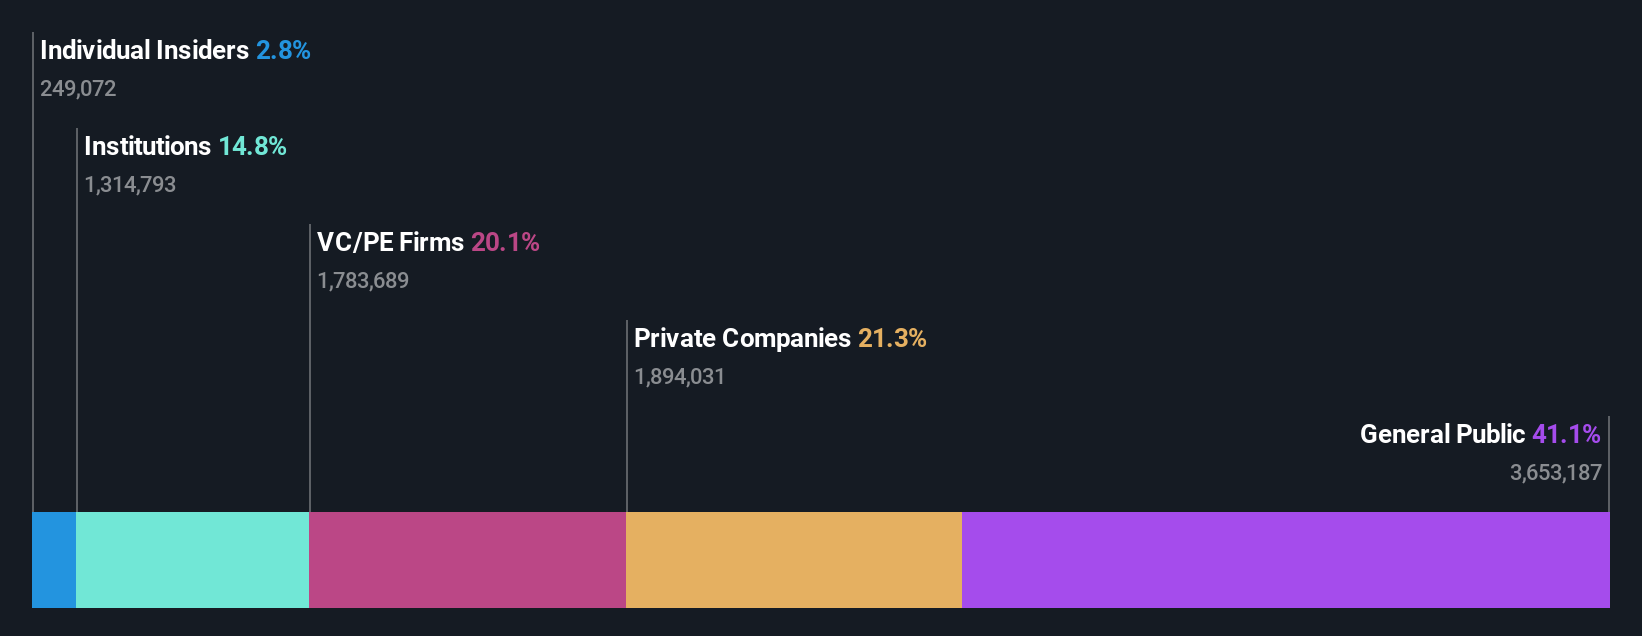
- Institutions own 15% of Kreate Group Oyj
To get a sense of who is truly in control of Kreate Group Oyj (HEL:KREATE), it is important to understand the ownership structure of the business. With 41% stake, retail investors possess the maximum shares in the company. Put another way, the group faces the maximum upside potential (or downside risk).
As a result, retail investors were the biggest beneficiaries of last week’s 12% gain.
Let's delve deeper into each type of owner of Kreate Group Oyj, beginning with the chart below.
See our latest analysis for Kreate Group Oyj
What Does The Institutional Ownership Tell Us About Kreate Group Oyj?
Many institutions measure their performance against an index that approximates the local market. So they usually pay more attention to companies that are included in major indices.
Kreate Group Oyj already has institutions on the share registry. Indeed, they own a respectable stake in the company. This implies the analysts working for those institutions have looked at the stock and they like it. But just like anyone else, they could be wrong. It is not uncommon to see a big share price drop if two large institutional investors try to sell out of a stock at the same time. So it is worth checking the past earnings trajectory of Kreate Group Oyj, (below). Of course, keep in mind that there are other factors to consider, too.

Kreate Group Oyj is not owned by hedge funds. The company's largest shareholder is Harjavalta Oy, with ownership of 20%. Meanwhile, the second and third largest shareholders, hold 11% and 4.8%, of the shares outstanding, respectively. Furthermore, CEO Timo Vikstrom is the owner of 0.6% of the company's shares.
We also observed that the top 7 shareholders account for more than half of the share register, with a few smaller shareholders to balance the interests of the larger ones to a certain extent.
While it makes sense to study institutional ownership data for a company, it also makes sense to study analyst sentiments to know which way the wind is blowing. There is a little analyst coverage of the stock, but not much. So there is room for it to gain more coverage.
Insider Ownership Of Kreate Group Oyj
The definition of company insiders can be subjective and does vary between jurisdictions. Our data reflects individual insiders, capturing board members at the very least. The company management answer to the board and the latter should represent the interests of shareholders. Notably, sometimes top-level managers are on the board themselves.
Insider ownership is positive when it signals leadership are thinking like the true owners of the company. However, high insider ownership can also give immense power to a small group within the company. This can be negative in some circumstances.
Shareholders would probably be interested to learn that insiders own shares in Kreate Group Oyj. As individuals, the insiders collectively own €3.2m worth of the €114m company. This shows at least some alignment, but we usually like to see larger insider holdings. You can click here to see if those insiders have been buying or selling.
General Public Ownership
The general public, who are usually individual investors, hold a 41% stake in Kreate Group Oyj. While this group can't necessarily call the shots, it can certainly have a real influence on how the company is run.
Private Equity Ownership
Private equity firms hold a 20% stake in Kreate Group Oyj. This suggests they can be influential in key policy decisions. Some investors might be encouraged by this, since private equity are sometimes able to encourage strategies that help the market see the value in the company. Alternatively, those holders might be exiting the investment after taking it public.
Private Company Ownership
Our data indicates that Private Companies hold 21%, of the company's shares. Private companies may be related parties. Sometimes insiders have an interest in a public company through a holding in a private company, rather than in their own capacity as an individual. While it's hard to draw any broad stroke conclusions, it is worth noting as an area for further research.
Next Steps:
While it is well worth considering the different groups that own a company, there are other factors that are even more important.
Many find it useful to take an in depth look at how a company has performed in the past. You can access this detailed graph of past earnings, revenue and cash flow.
If you would prefer discover what analysts are predicting in terms of future growth, do not miss this free report on analyst forecasts.
NB: Figures in this article are calculated using data from the last twelve months, which refer to the 12-month period ending on the last date of the month the financial statement is dated. This may not be consistent with full year annual report figures.
Have feedback on this article? Concerned about the content? Get in touch with us directly. Alternatively, email editorial-team (at) simplywallst.com.
This article by Simply Wall St is general in nature. We provide commentary based on historical data and analyst forecasts only using an unbiased methodology and our articles are not intended to be financial advice. It does not constitute a recommendation to buy or sell any stock, and does not take account of your objectives, or your financial situation. We aim to bring you long-term focused analysis driven by fundamental data. Note that our analysis may not factor in the latest price-sensitive company announcements or qualitative material. Simply Wall St has no position in any stocks mentioned.