
 Nasdaq
 华尔街日报
华尔街日报Assessing CACI International’s Valuation After Strong Multi Year Share Price Gains
- If you are wondering whether CACI International is still worth considering after a big run, or if most of the upside is already priced in, this breakdown is designed to help you figure that out without getting lost in jargon.
- The stock has cooled off recently, slipping about 2.8% over the last week and 9.2% over the past month. It is still up 32.5% year to date and 34.5% over the last year, with returns of 79.8% over 3 years and 118.7% over 5 years.
- Behind those moves, investors have been reacting to CACI's steady flow of new defense and intelligence contracts, ongoing demand for secure IT and mission support, and a broader rerating of high quality government services providers as dependable compounders. These trends have pushed expectations higher and set the stage for a closer look at whether the current price fairly reflects the company’s long term growth potential.
- On our valuation checks, CACI International scores 6 out of 6 for being undervalued across multiple fundamental metrics, which you can see in detail in its valuation score. Next, we will walk through those valuation approaches one by one, then finish with a more holistic way to think about what this business is really worth.
Approach 1: CACI International Discounted Cash Flow (DCF) Analysis
A Discounted Cash Flow model estimates what a company is worth by projecting the cash it can generate in the future and then discounting those cash flows back to today in dollar terms.
For CACI International, the latest twelve month free cash flow is about $609.6 million. Analysts and extrapolated forecasts from Simply Wall St see this rising to roughly $930.8 million by 2035, with interim projections such as $725.2 million in 2026 and $790.1 million in 2028. These estimates are fed into a 2 Stage Free Cash Flow to Equity model, which applies a higher growth phase followed by a more mature, slower growth period, and then discounts each year back to present value.
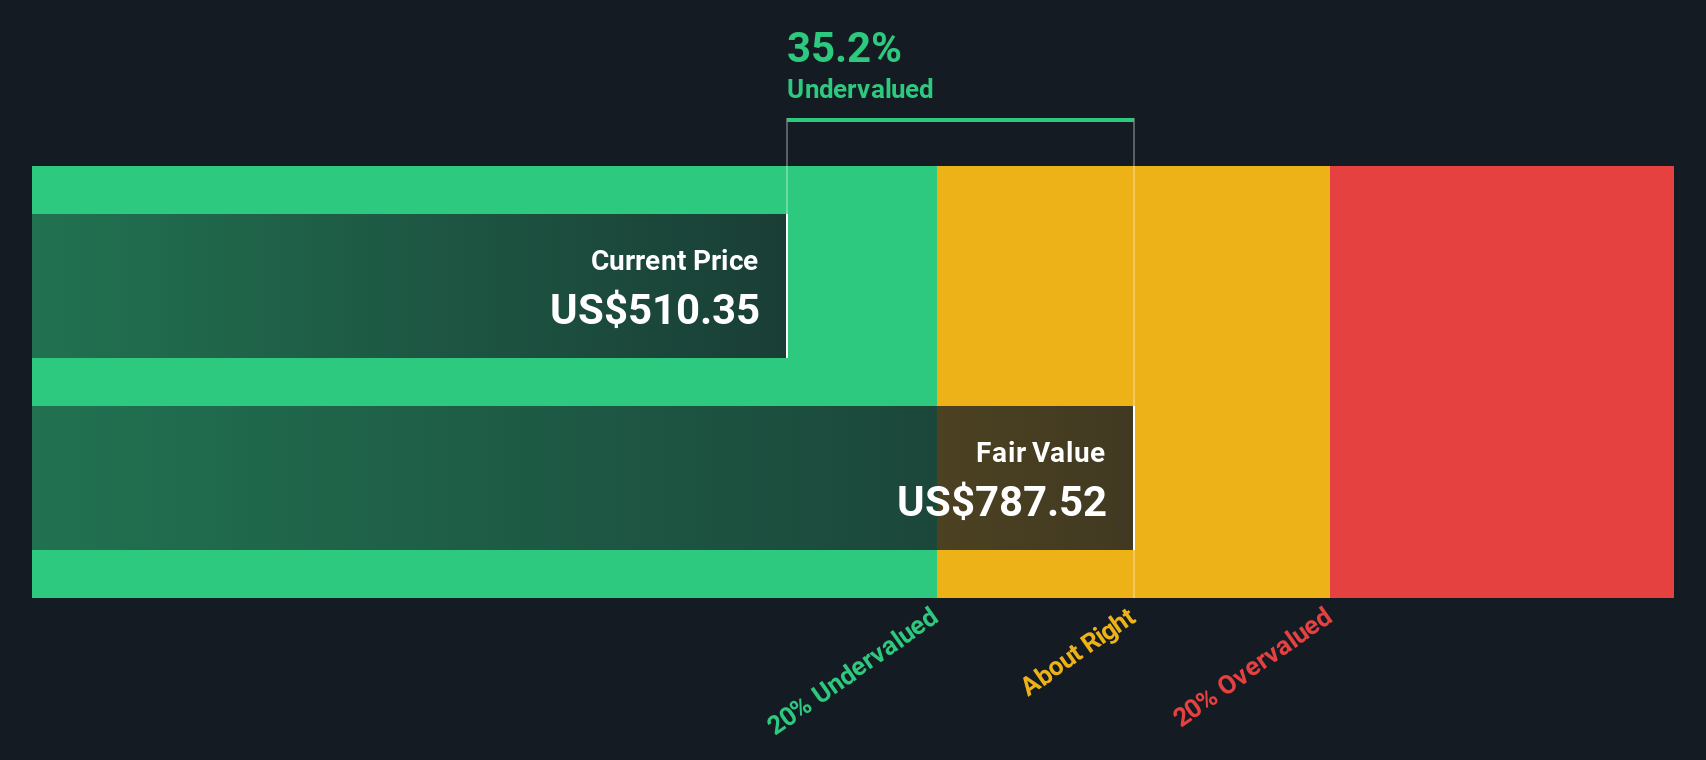
On this basis, the model arrives at an intrinsic value of about $727.55 per share. Compared with the current market price, the DCF implies the stock is trading at roughly a 25.2% discount.
Result: UNDERVALUED
Our Discounted Cash Flow (DCF) analysis suggests CACI International is undervalued by 25.2%. Track this in your watchlist or portfolio, or discover 908 more undervalued stocks based on cash flows.
Approach 2: CACI International Price vs Earnings
For profitable businesses like CACI International, the price to earnings ratio is a straightforward way to gauge how much investors are paying for each dollar of current profits. A higher PE ratio usually reflects stronger growth expectations or lower perceived risk, while slower growth or higher risk typically justifies a lower, more conservative multiple.
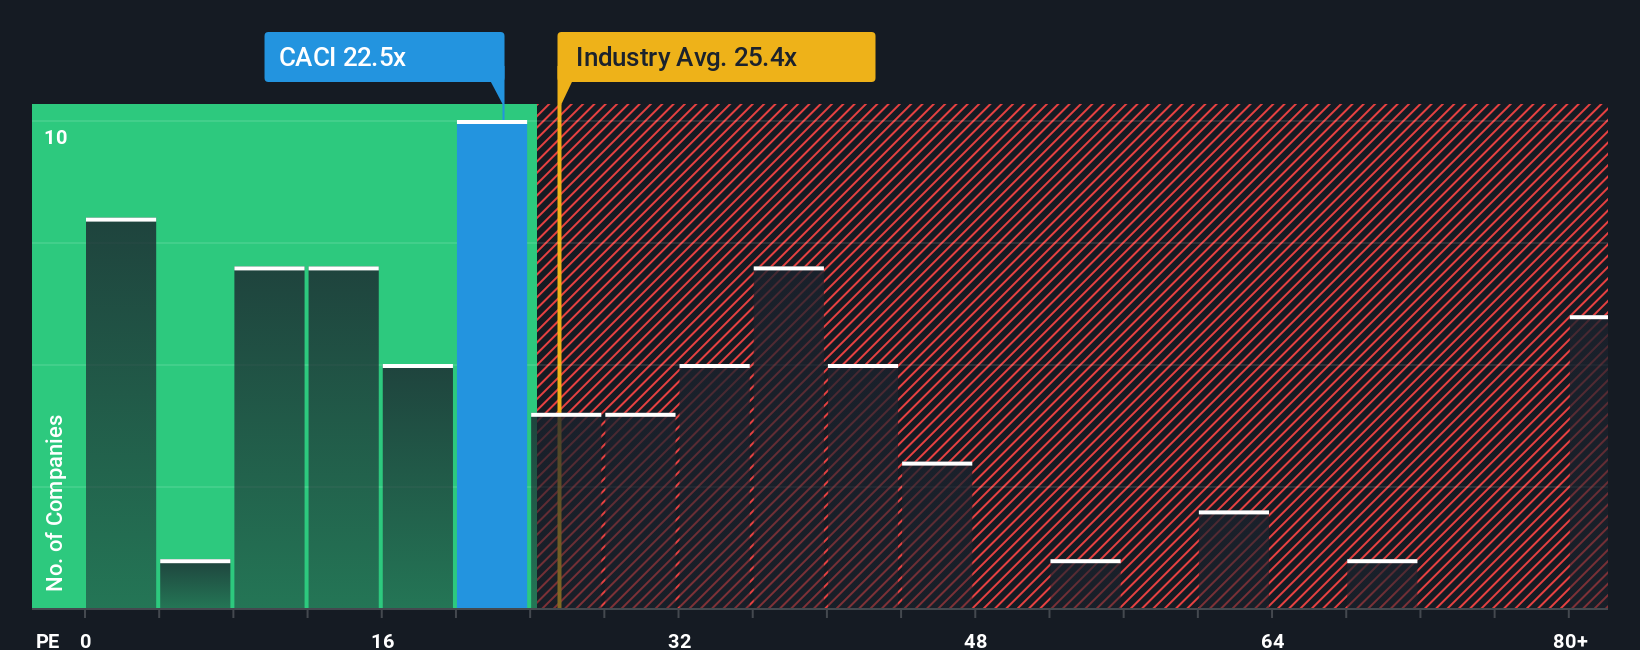
CACI currently trades on about 23.83x earnings. That is slightly below the broader Professional Services industry average of roughly 24.58x and meaningfully below the peer group average of around 38.24x. This suggests the market is valuing CACI more conservatively than many comparable names. However, simple comparisons like this can miss important nuances in growth, profitability, and risk.
To address that, Simply Wall St uses a Fair Ratio, a proprietary estimate of what CACI’s PE should be given its earnings growth outlook, margins, industry, market cap, and risk profile. For CACI, this Fair Ratio is 26.01x, which sits above its current 23.83x multiple. Because the Fair Ratio better reflects the company’s specific fundamentals than broad peer or industry averages, this points to CACI trading below what would be considered a fair earnings multiple.
Result: UNDERVALUED
PE ratios tell one story, but what if the real opportunity lies elsewhere? Discover 1457 companies where insiders are betting big on explosive growth.
Upgrade Your Decision Making: Choose your CACI International Narrative
Earlier we mentioned that there is an even better way to understand valuation, so let us introduce you to Narratives, a simple way for you to attach a clear story to your assumptions about fair value, future revenue, earnings and margins, and then see how that story translates into a forecast and a valuation you can compare with today’s share price.
A Narrative links three things together: your view of the business, the numbers that express that view in a forecast, and the resulting fair value. On Simply Wall St’s Community page, millions of investors use Narratives as an accessible tool to decide whether a stock looks like a buy, hold or sell by comparing its Narrative-based fair value to the current market price.
Because Narratives are dynamic, they automatically update as new information comes in, such as CACI’s latest contract wins, backlog guidance or funding headlines. This means your story and valuation stay current without you having to rebuild your model from scratch.
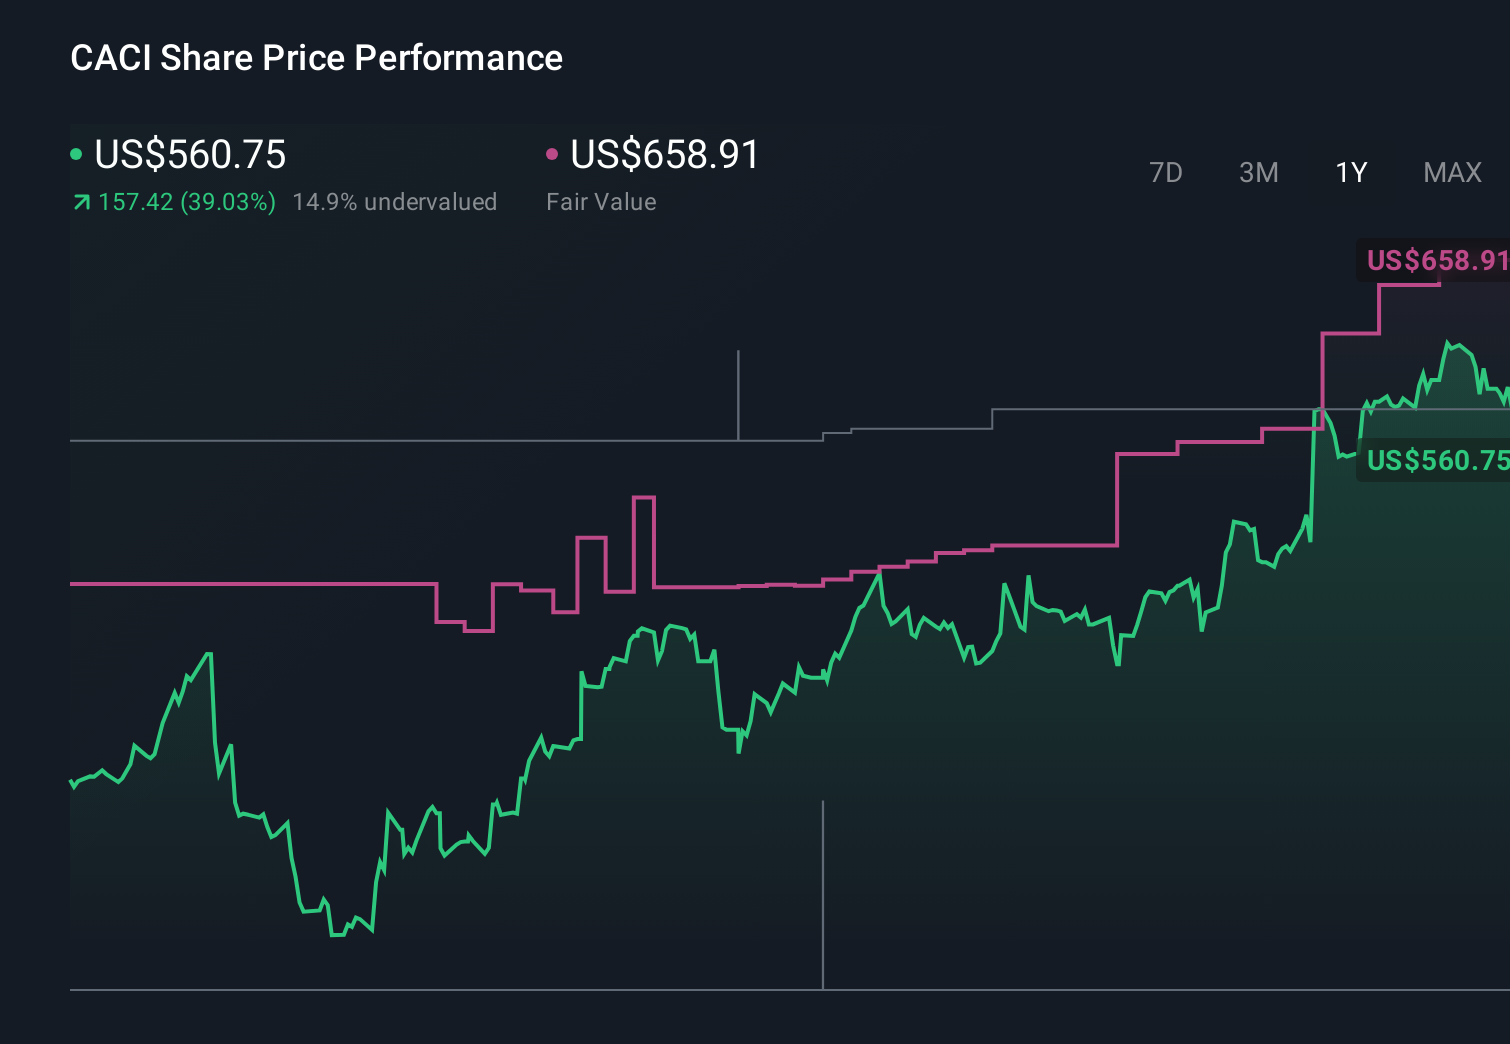
For example, one CACI International Narrative might lean bullish, assuming robust backlog conversion, steady margin expansion and a fair value near $670. A more cautious Narrative could focus on funding and execution risks, use the same 6.5% revenue growth with lower margins and a smaller multiple, and land closer to $560. By comparing these perspectives side by side, you can quickly see which story you find more believable and decide how that aligns with your own view.
Do you think there's more to the story for CACI International? Head over to our Community to see what others are saying!
This article by Simply Wall St is general in nature. We provide commentary based on historical data and analyst forecasts only using an unbiased methodology and our articles are not intended to be financial advice. It does not constitute a recommendation to buy or sell any stock, and does not take account of your objectives, or your financial situation. We aim to bring you long-term focused analysis driven by fundamental data. Note that our analysis may not factor in the latest price-sensitive company announcements or qualitative material. Simply Wall St has no position in any stocks mentioned.
Have feedback on this article? Concerned about the content? Get in touch with us directly. Alternatively, email editorial-team@simplywallst.com