
 Nasdaq
 华尔街日报
华尔街日报Atul Ltd (NSE:ATUL) surges 5.7%; private companies who own 43% shares profited along with institutions
Key Insights
- The considerable ownership by private companies in Atul indicates that they collectively have a greater say in management and business strategy
- 50% of the business is held by the top 6 shareholders
- 33% of Atul is held by Institutions
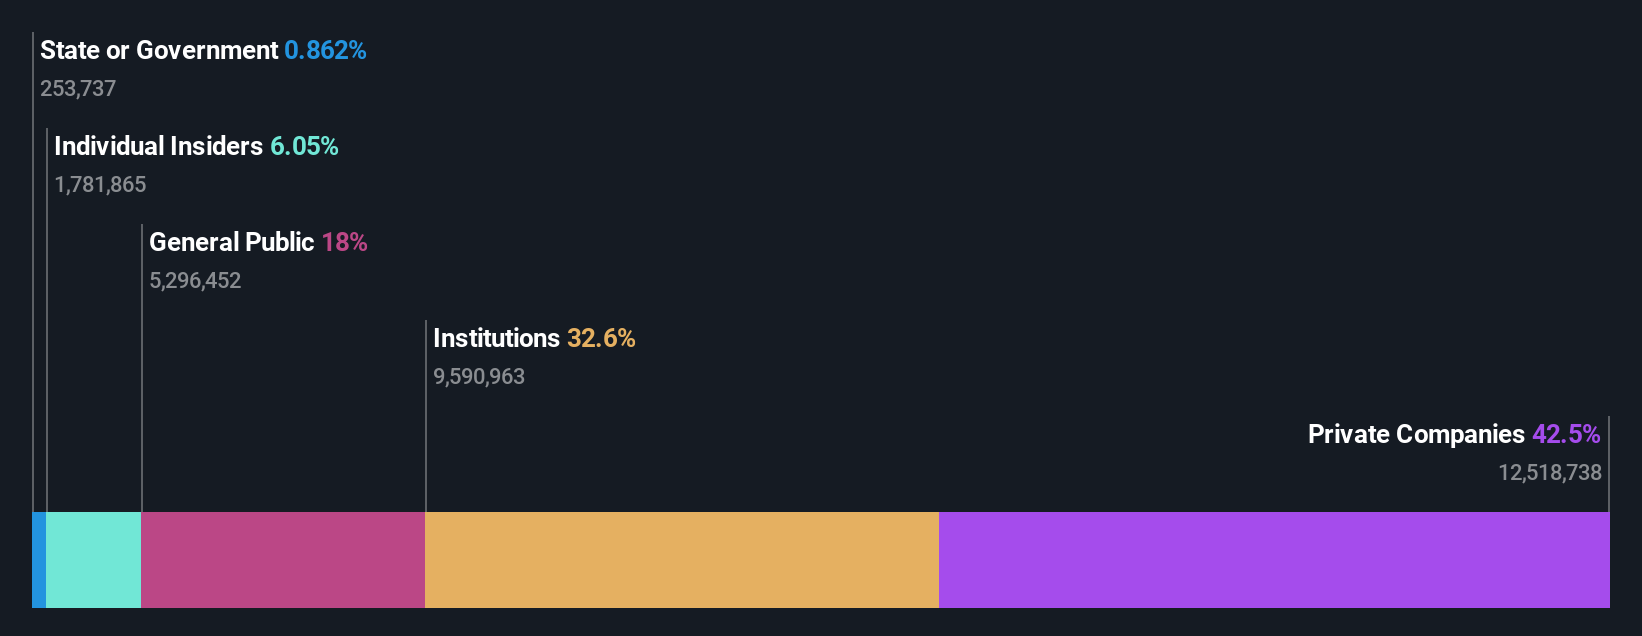
Every investor in Atul Ltd (NSE:ATUL) should be aware of the most powerful shareholder groups. The group holding the most number of shares in the company, around 43% to be precise, is private companies. In other words, the group stands to gain the most (or lose the most) from their investment into the company.
While private companies were the group that reaped the most benefits after last week’s 5.7% price gain, institutions also received a 33% cut.
Let's delve deeper into each type of owner of Atul, beginning with the chart below.
Check out our latest analysis for Atul
What Does The Institutional Ownership Tell Us About Atul?
Institutions typically measure themselves against a benchmark when reporting to their own investors, so they often become more enthusiastic about a stock once it's included in a major index. We would expect most companies to have some institutions on the register, especially if they are growing.
We can see that Atul does have institutional investors; and they hold a good portion of the company's stock. This suggests some credibility amongst professional investors. But we can't rely on that fact alone since institutions make bad investments sometimes, just like everyone does. It is not uncommon to see a big share price drop if two large institutional investors try to sell out of a stock at the same time. So it is worth checking the past earnings trajectory of Atul, (below). Of course, keep in mind that there are other factors to consider, too.

Hedge funds don't have many shares in Atul. The company's largest shareholder is Aagam Holdings Pvt Ltd., with ownership of 23%. Meanwhile, the second and third largest shareholders, hold 9.5% and 5.4%, of the shares outstanding, respectively. Furthermore, CEO Sunil Lalbhai is the owner of 0.7% of the company's shares.
We also observed that the top 6 shareholders account for more than half of the share register, with a few smaller shareholders to balance the interests of the larger ones to a certain extent.
Researching institutional ownership is a good way to gauge and filter a stock's expected performance. The same can be achieved by studying analyst sentiments. There are a reasonable number of analysts covering the stock, so it might be useful to find out their aggregate view on the future.
Insider Ownership Of Atul
The definition of company insiders can be subjective and does vary between jurisdictions. Our data reflects individual insiders, capturing board members at the very least. Company management run the business, but the CEO will answer to the board, even if he or she is a member of it.
Insider ownership is positive when it signals leadership are thinking like the true owners of the company. However, high insider ownership can also give immense power to a small group within the company. This can be negative in some circumstances.
We can see that insiders own shares in Atul Ltd. It is a pretty big company, so it is generally a positive to see some potentially meaningful alignment. In this case, they own around ₹11b worth of shares (at current prices). It is good to see this level of investment by insiders. You can check here to see if those insiders have been buying recently.
General Public Ownership
The general public-- including retail investors -- own 18% stake in the company, and hence can't easily be ignored. This size of ownership, while considerable, may not be enough to change company policy if the decision is not in sync with other large shareholders.
Private Company Ownership
It seems that Private Companies own 43%, of the Atul stock. It might be worth looking deeper into this. If related parties, such as insiders, have an interest in one of these private companies, that should be disclosed in the annual report. Private companies may also have a strategic interest in the company.
Next Steps:
I find it very interesting to look at who exactly owns a company. But to truly gain insight, we need to consider other information, too. Consider risks, for instance. Every company has them, and we've spotted 1 warning sign for Atul you should know about.
If you are like me, you may want to think about whether this company will grow or shrink. Luckily, you can check this free report showing analyst forecasts for its future.
NB: Figures in this article are calculated using data from the last twelve months, which refer to the 12-month period ending on the last date of the month the financial statement is dated. This may not be consistent with full year annual report figures.
Have feedback on this article? Concerned about the content? Get in touch with us directly. Alternatively, email editorial-team (at) simplywallst.com.
This article by Simply Wall St is general in nature. We provide commentary based on historical data and analyst forecasts only using an unbiased methodology and our articles are not intended to be financial advice. It does not constitute a recommendation to buy or sell any stock, and does not take account of your objectives, or your financial situation. We aim to bring you long-term focused analysis driven by fundamental data. Note that our analysis may not factor in the latest price-sensitive company announcements or qualitative material. Simply Wall St has no position in any stocks mentioned.