
 Nasdaq
 华尔街日报
华尔街日报Is STAAR Surgical A Bargain After Years of Share Price Declines?
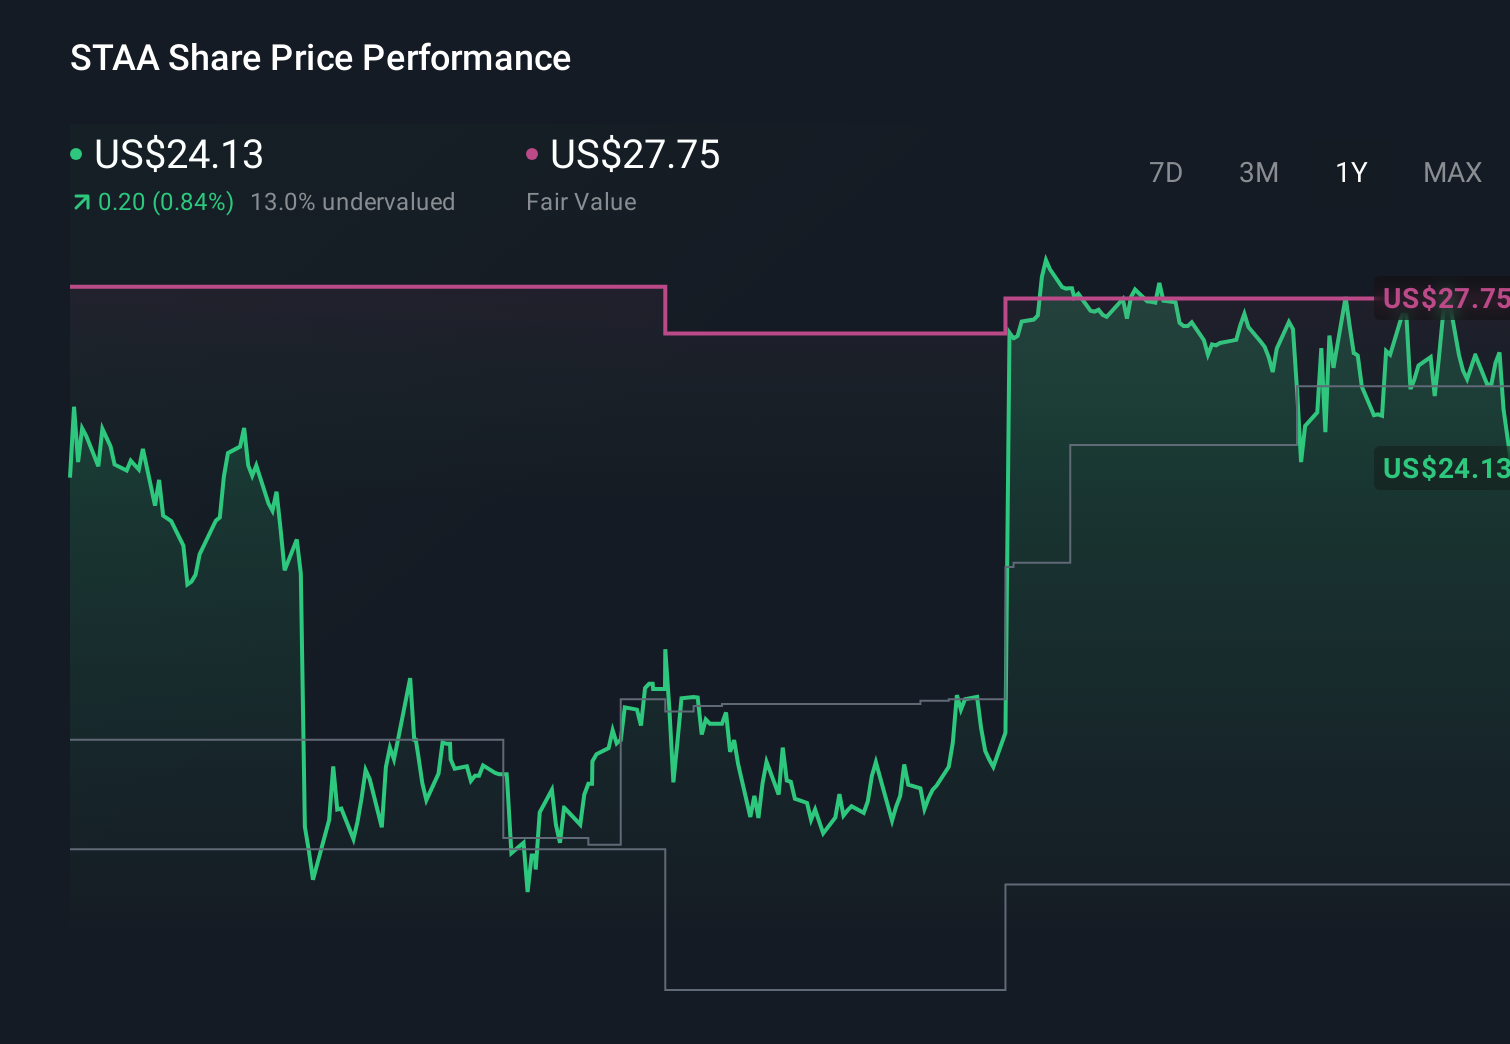
- Wondering if STAAR Surgical at around $24 a share is a hidden bargain or a value trap? You are not alone, and that is exactly what we are going to unpack.
- The stock has been choppy, up 2.7% over the last week but down 13.6% over the past month. Despite being barely positive year to date at 0.4%, it is still sitting on steep losses of around 50% over three years and 70% over five.
- Those big swings are set against a backdrop of ongoing excitement around implantable Collamer lenses and the broader vision correction market, where STAAR is positioned as a niche, technology driven player. At the same time, investor sentiment has been tempered by execution concerns and competitive pressure in refractive surgery solutions. This helps explain why the share price has struggled to regain its old highs.
- On our scorecard, STAAR Surgical currently earns a 2 out of 6 valuation score, meaning it screens as undervalued on only a couple of checks. In the rest of this article we will walk through what different valuation methods say about that number and introduce a more nuanced way to think about value by the end.
STAAR Surgical scores just 2/6 on our valuation checks. See what other red flags we found in the full valuation breakdown.
Approach 1: STAAR Surgical Discounted Cash Flow (DCF) Analysis
A Discounted Cash Flow model takes estimates of how much cash a business will generate in the future and discounts those cash flows back to today to arrive at an intrinsic value per share.
For STAAR Surgical, the latest twelve month Free Cash Flow is negative at around $42.7 million, so the model leans heavily on future improvement. Analysts and extrapolations suggest Free Cash Flow could rise to about $126 million by 2035, with interim milestones such as $36 million in 2027 and $66 million in 2029 as the business scales.
Using a 2 Stage Free Cash Flow to Equity approach, these projected cash flows are discounted back to the present, giving an estimated fair value of roughly $37.27 per share. With the stock trading around $24, the DCF implies the shares are about 35.1% undervalued on this set of assumptions.
This framework presents STAAR as a growth dependent opportunity in which execution on future cash generation is key to realizing that apparent discount.
Result: UNDERVALUED
Our Discounted Cash Flow (DCF) analysis suggests STAAR Surgical is undervalued by 35.1%. Track this in your watchlist or portfolio, or discover 900 more undervalued stocks based on cash flows.

Approach 2: STAAR Surgical Price vs Sales
For a company like STAAR that is still leaning on future growth rather than consistent profits, the price to sales ratio is a practical way to gauge value because it focuses on what the business is already generating in revenue, not what falls to the bottom line yet.
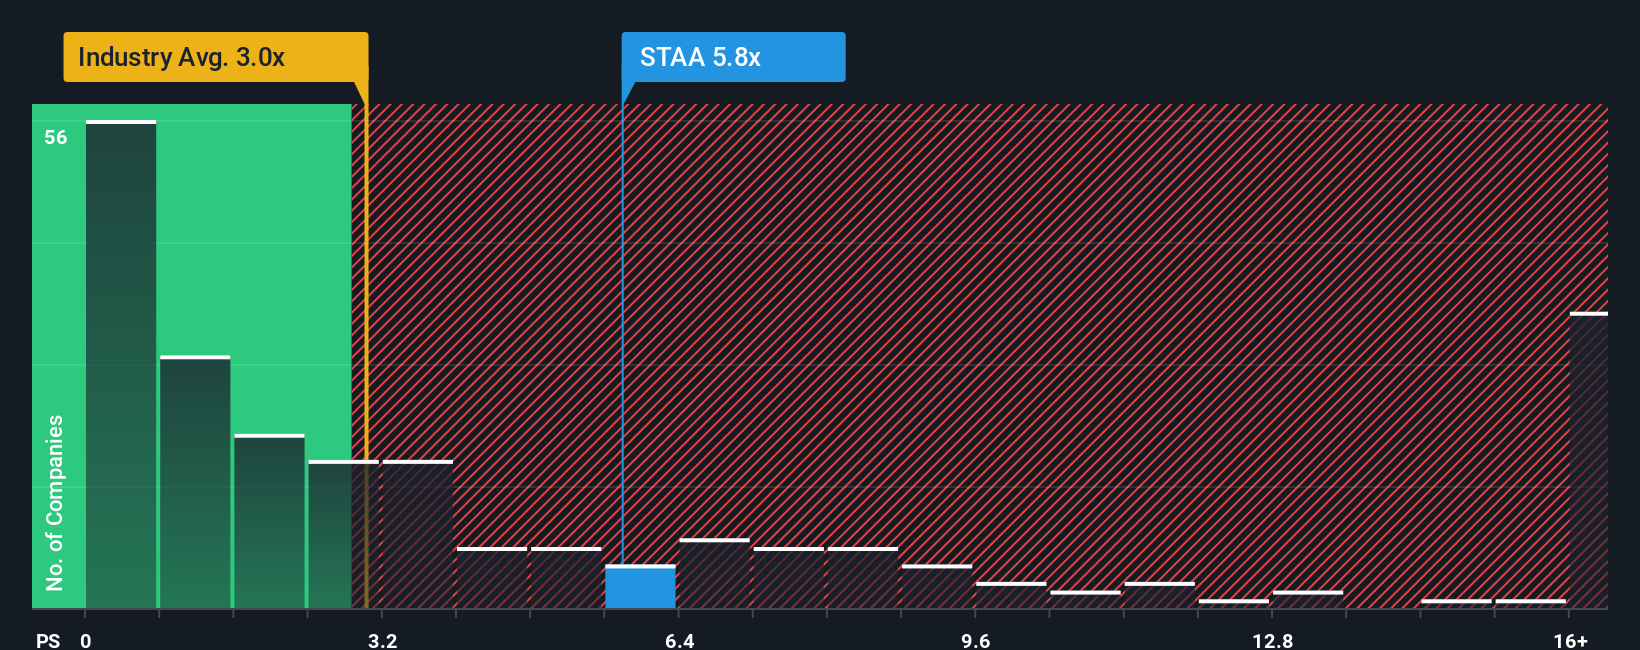
In general, faster and more reliable revenue growth, with less risk, can justify a higher normal price to sales multiple, while slower or more volatile growth usually calls for a lower one. STAAR currently trades on a price to sales ratio of about 5.2x, which is well above the broader Medical Equipment industry average of around 3.2x and also above its peer group at roughly 3.7x.
Simply Wall St’s Fair Ratio framework estimates what a justified price to sales multiple should be after adjusting for factors such as STAAR’s growth outlook, profitability profile, risk, industry positioning and market cap. This tends to be more precise than a simple peer or industry comparison because it accounts for the company’s specific strengths and weaknesses. On that basis, STAAR’s Fair Ratio is about 3.8x, noticeably lower than the current 5.2x. This points to a stock that is priced ahead of its fundamentals.
Result: OVERVALUED
PS ratios tell one story, but what if the real opportunity lies elsewhere? Discover 1458 companies where insiders are betting big on explosive growth.
Upgrade Your Decision Making: Choose your STAAR Surgical Narrative
Earlier we mentioned that there is an even better way to understand valuation, so let us introduce you to Narratives, a simple way to connect your view of STAAR Surgical’s future with a set of numbers like revenue, earnings, margins and ultimately a fair value per share.
A Narrative is your story about the company made explicit, linking what you believe about its products, competition, and growth runway to a concrete financial forecast and the fair value that drops out of those assumptions.
On Simply Wall St, Narratives are an easy, accessible tool available on the Community page. There, millions of investors translate their perspectives into scenarios that can be compared directly with today’s share price to decide whether STAAR looks like a buy, hold, or sell to them.
Because Narratives update dynamically as new information such as earnings releases, China market data, or merger news comes in, your fair value view evolves automatically and stays aligned with the latest developments.
For example, one STAAR Narrative might assume a fair value near the more optimistic end of analyst targets at about $28. A more cautious Narrative could come in closer to $16, showing how different views on growth, margins, and deal outcomes can reasonably coexist on the same stock.
Do you think there's more to the story for STAAR Surgical? Head over to our Community to see what others are saying!
This article by Simply Wall St is general in nature. We provide commentary based on historical data and analyst forecasts only using an unbiased methodology and our articles are not intended to be financial advice. It does not constitute a recommendation to buy or sell any stock, and does not take account of your objectives, or your financial situation. We aim to bring you long-term focused analysis driven by fundamental data. Note that our analysis may not factor in the latest price-sensitive company announcements or qualitative material. Simply Wall St has no position in any stocks mentioned.
Have feedback on this article? Concerned about the content? Get in touch with us directly. Alternatively, email editorial-team@simplywallst.com