
 Nasdaq
 华尔街日报
华尔街日报Venture Global (VG): Reassessing Valuation After a Sharp Short-Term Rebound and Steep Year-to-Date Decline
Venture Global (VG) has quietly turned into a roller coaster for investors, with the stock jumping 4% in a day but still sitting deeply red over the past 3 months and year to date.
See our latest analysis for Venture Global.
That sharp 1 day and 7 day share price return rebound comes after months of heavy selling, with the 90 day and year to date share price returns still pointing to fading momentum as investors reassess both growth prospects and risk.
Given how quickly sentiment can swing in energy, it might be worth scanning beyond Venture Global and seeing what else is setting up interestingly through aerospace and defense stocks.
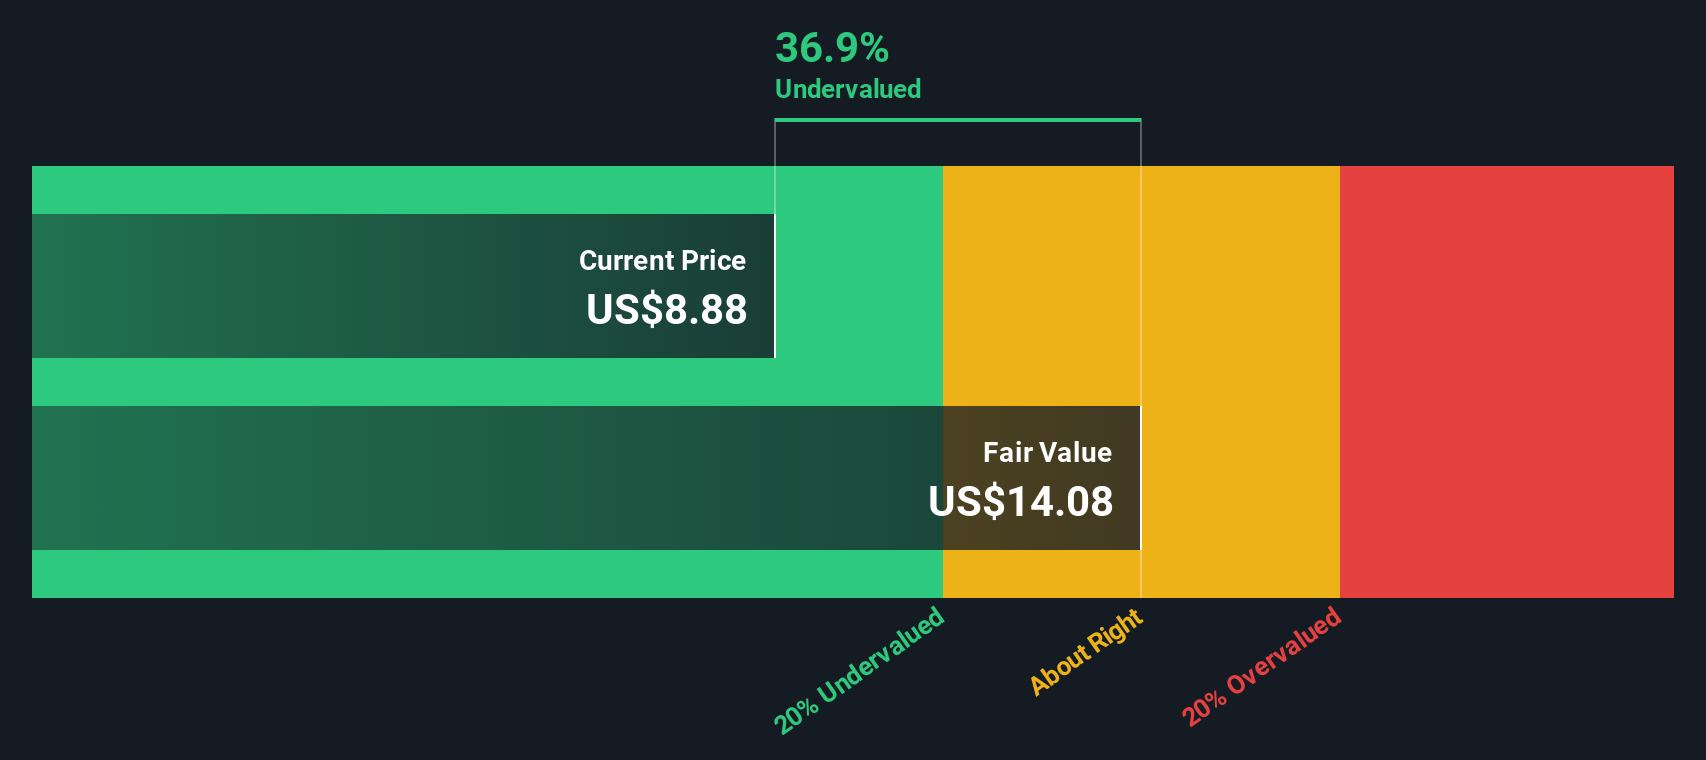
With shares down more than 70% year to date and trading at a steep discount to analyst targets, the key question now is simple: Is Venture Global an undervalued recovery story, or is the market already pricing in future growth?
Price-to-Earnings of 7.8x: Is it justified?
At a last close of $6.61, Venture Global trades on a 7.8x price to earnings multiple, a level that screens as inexpensive versus peers.
The price to earnings ratio compares the company’s share price to its earnings per share, making it a simple shorthand for how much investors pay for each dollar of profit. For an energy and LNG exporter like Venture Global, this multiple reflects the market’s view on the durability of current earnings, future commodity cycles, and the capital intensity of large scale projects.
Here, the picture is mixed. On one hand, Venture Global is described as trading at good value relative to peers and industry, with its 7.8x price to earnings ratio sitting well below the US market and the broader US Oil and Gas average. On the other hand, our SWS DCF model estimates that the shares, at $6.61, are trading above a fair value of around $1.48. This implies that while the earnings multiple looks inexpensive on the surface, cash flow based valuation tells a more conservative story.
Against the US Oil and Gas sector, where the average price to earnings ratio is about 12.9x, Venture Global’s 7.8x stands out as sharply lower. This suggests the market is pricing in more muted earnings power or higher risk than for typical peers. When set beside the estimated fair price to earnings ratio of 12.4x, the current multiple also looks compressed, highlighting how far sentiment has moved relative to what longer term fundamentals might support if execution stays on track.
Explore the SWS fair ratio for Venture Global
Result: Price-to-Earnings of 7.8x (UNDERVALUED)
However, persistent net income contraction and execution risk on capital intensive LNG projects could quickly undermine the case for a clean, valuation-driven recovery.
Find out about the key risks to this Venture Global narrative.
Another View: Cash Flows Paint a Tougher Picture
Our DCF model takes a different angle and suggests Venture Global is actually overvalued at $6.61, with a fair value estimate closer to $1.48. That is a steep gap, raising the question of whether current earnings can truly be sustained.
Look into how the SWS DCF model arrives at its fair value.
Simply Wall St performs a discounted cash flow (DCF) on every stock in the world every day (check out Venture Global for example). We show the entire calculation in full. You can track the result in your watchlist or portfolio and be alerted when this changes, or use our stock screener to discover 900 undervalued stocks based on their cash flows. If you save a screener we even alert you when new companies match - so you never miss a potential opportunity.
Build Your Own Venture Global Narrative
If you see the numbers differently or want to stress test the assumptions yourself, you can build a complete view in minutes with Do it your way.
A great starting point for your Venture Global research is our analysis highlighting 4 key rewards and 3 important warning signs that could impact your investment decision.
Looking for more investment ideas?
Do not stop at one opportunity when you can line up your next moves. Use the Simply Wall Street Screener to spot fresh, data backed candidates now.
- Target potentially mispriced opportunities by scanning these 900 undervalued stocks based on cash flows that combine attractive cash flow profiles with room for sentiment to improve.
- Ride powerful secular themes by checking out these 24 AI penny stocks positioned at the forefront of automation, data analytics, and intelligent software.
- Strengthen your income game by reviewing these 10 dividend stocks with yields > 3% that aim to balance yield, payout sustainability, and long term resilience.
This article by Simply Wall St is general in nature. We provide commentary based on historical data and analyst forecasts only using an unbiased methodology and our articles are not intended to be financial advice. It does not constitute a recommendation to buy or sell any stock, and does not take account of your objectives, or your financial situation. We aim to bring you long-term focused analysis driven by fundamental data. Note that our analysis may not factor in the latest price-sensitive company announcements or qualitative material. Simply Wall St has no position in any stocks mentioned.
Have feedback on this article? Concerned about the content? Get in touch with us directly. Alternatively, email editorial-team@simplywallst.com