
 Nasdaq
 华尔街日报
华尔街日报Assessing Howmet Aerospace After an 88% Surge and Soaring Aerospace Demand in 2025
- If you are wondering whether Howmet Aerospace is still worth considering after such a large run up, or if you are late to the party, this breakdown will walk through what the current price might really be telling you.
- The stock has climbed 5.5% over the last week and month, and is now up an eye catching 87.9% year to date and 88.8% over the past year, with a massive 661.0% gain over five years reshaping how investors perceive its potential and risk.
- Recent headlines have focused on Howmet's role as a key supplier to commercial aerospace and defense platforms. Investors have been encouraged by stronger demand for lightweight engineered components as global air travel and defense spending remain elevated. At the same time, coverage has highlighted the company as a beneficiary of long cycle aircraft build rates and fleet upgrades, which helps explain why the market has been willing to re rate the shares.
- Despite that optimism, Howmet currently scores just 0 out of 6 on our valuation checks. In the sections that follow, we will unpack what different valuation methods say about the stock today, and then finish with a more holistic way to think about value beyond the usual models.
Howmet Aerospace scores just 0/6 on our valuation checks. See what other red flags we found in the full valuation breakdown.
Approach 1: Howmet Aerospace Discounted Cash Flow (DCF) Analysis
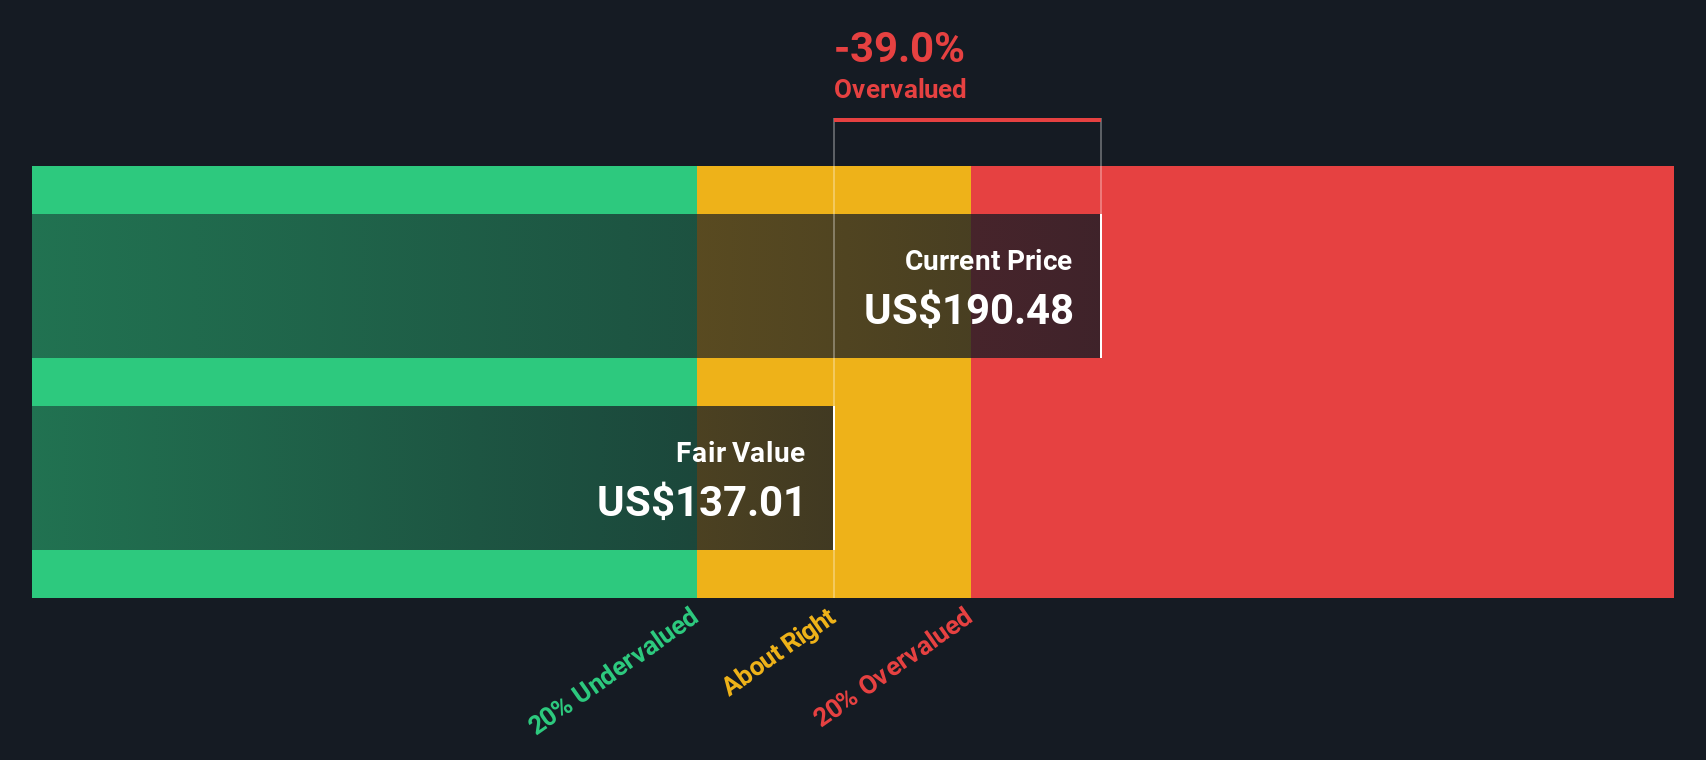
A Discounted Cash Flow model estimates what a company is worth by projecting its future cash flows and then discounting them back to today in $ terms. For Howmet Aerospace, the 2 Stage Free Cash Flow to Equity model starts with last twelve months free cash flow of about $1.37 billion and uses analyst forecasts for the next few years, then extends those trends further into the future.
Analysts and extrapolations suggest free cash flow could rise toward roughly $3.26 billion by 2035, with interim projections stepping up from around $1.59 billion in 2026 as aircraft build rates and demand for engineered components grow. When all those future cash flows are discounted back, the model arrives at an estimated intrinsic value of about $133.34 per share.
Compared to the current share price, this implies the stock is roughly 56.1% overvalued based on cash flow alone, suggesting expectations embedded in the market price are already very optimistic.
Result: OVERVALUED
Our Discounted Cash Flow (DCF) analysis suggests Howmet Aerospace may be overvalued by 56.1%. Discover 898 undervalued stocks or create your own screener to find better value opportunities.
Approach 2: Howmet Aerospace Price vs Earnings
For profitable companies like Howmet Aerospace, the price to earnings, or PE, ratio is a useful way to gauge how much investors are paying today for each dollar of current earnings. In general, faster growth and lower perceived risk justify a higher PE, while slower growth or higher uncertainty usually mean a lower, more conservative multiple is appropriate.
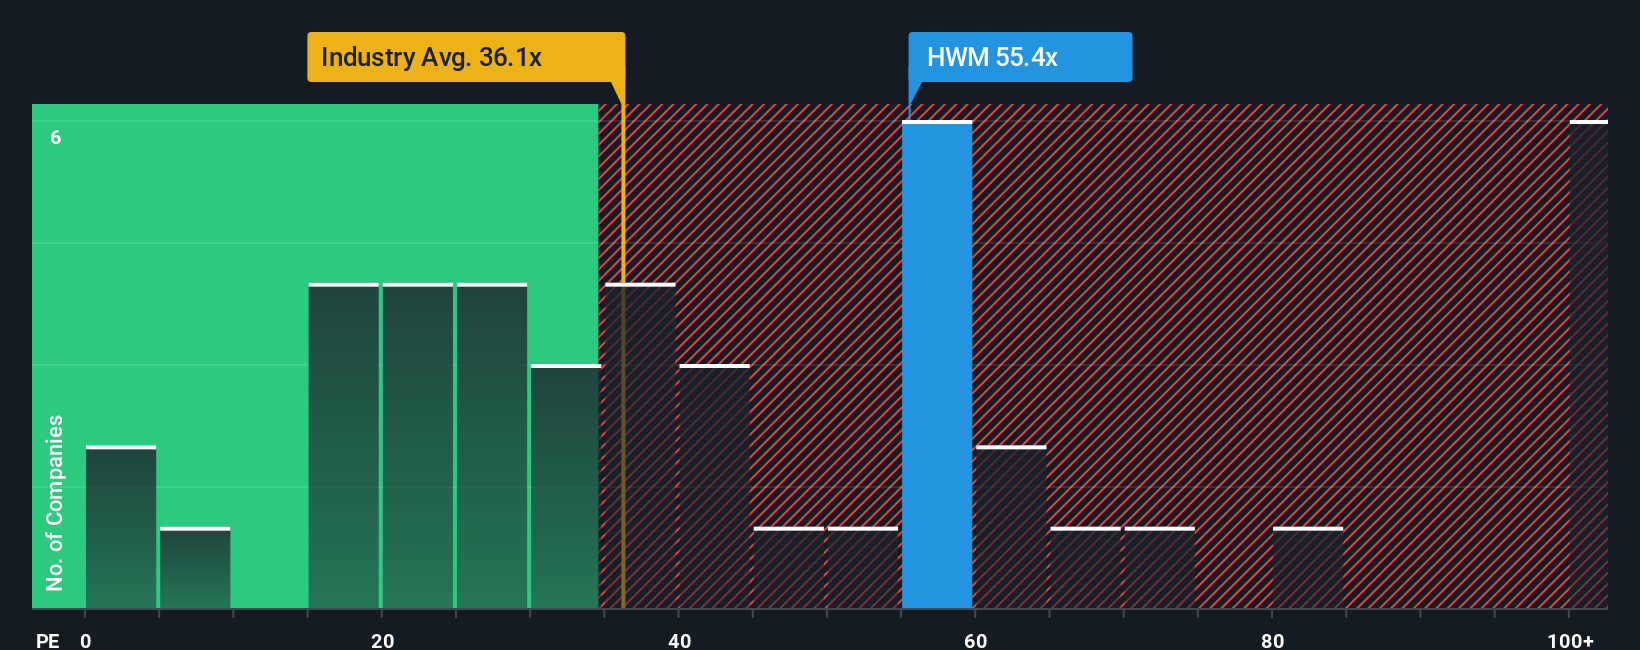
Howmet currently trades on a PE of about 57.80x, which is well above both the Aerospace and Defense industry average of roughly 38.37x and the peer group average of around 28.38x. On the surface, that signals the market is pricing in stronger growth and quality than the typical stock in its space.
Simply Wall St also calculates a Fair Ratio, which in this case is 35.58x. This is a proprietary estimate of what a reasonable PE might be for Howmet given its earnings growth outlook, profitability, industry, market cap and risk profile. Because it blends these company specific fundamentals rather than relying only on broad peer or industry comparisons, it offers a more tailored benchmark. With the current PE sitting well above the 35.58x Fair Ratio, the shares look extended on an earnings multiple basis.
Result: OVERVALUED
PE ratios tell one story, but what if the real opportunity lies elsewhere? Discover 1458 companies where insiders are betting big on explosive growth.
Upgrade Your Decision Making: Choose your Howmet Aerospace Narrative
Earlier we mentioned that there is an even better way to understand valuation, so let's introduce you to Narratives, a simple framework on Simply Wall St's Community page that lets you connect your story about a company to concrete forecasts for revenue, earnings and margins, and then to a fair value you can compare to the current share price to help you think about whether to buy, hold or sell.
In practice, a Narrative is your own structured view of Howmet Aerospace. You might, for example, assume that double digit revenue growth, expanding margins and strong aero engine spares demand justify a fair value close to $250. A more cautious investor, focused on capex risk, OEM concentration and potential margin pressure, might land nearer $186. Both Narratives will automatically update as new earnings, news or guidance are released, so your fair value estimate stays aligned with the latest information without you needing to rebuild your model from scratch.
Do you think there's more to the story for Howmet Aerospace? Head over to our Community to see what others are saying!

This article by Simply Wall St is general in nature. We provide commentary based on historical data and analyst forecasts only using an unbiased methodology and our articles are not intended to be financial advice. It does not constitute a recommendation to buy or sell any stock, and does not take account of your objectives, or your financial situation. We aim to bring you long-term focused analysis driven by fundamental data. Note that our analysis may not factor in the latest price-sensitive company announcements or qualitative material. Simply Wall St has no position in any stocks mentioned.
Have feedback on this article? Concerned about the content? Get in touch with us directly. Alternatively, email editorial-team@simplywallst.com