
 Nasdaq
 华尔街日报
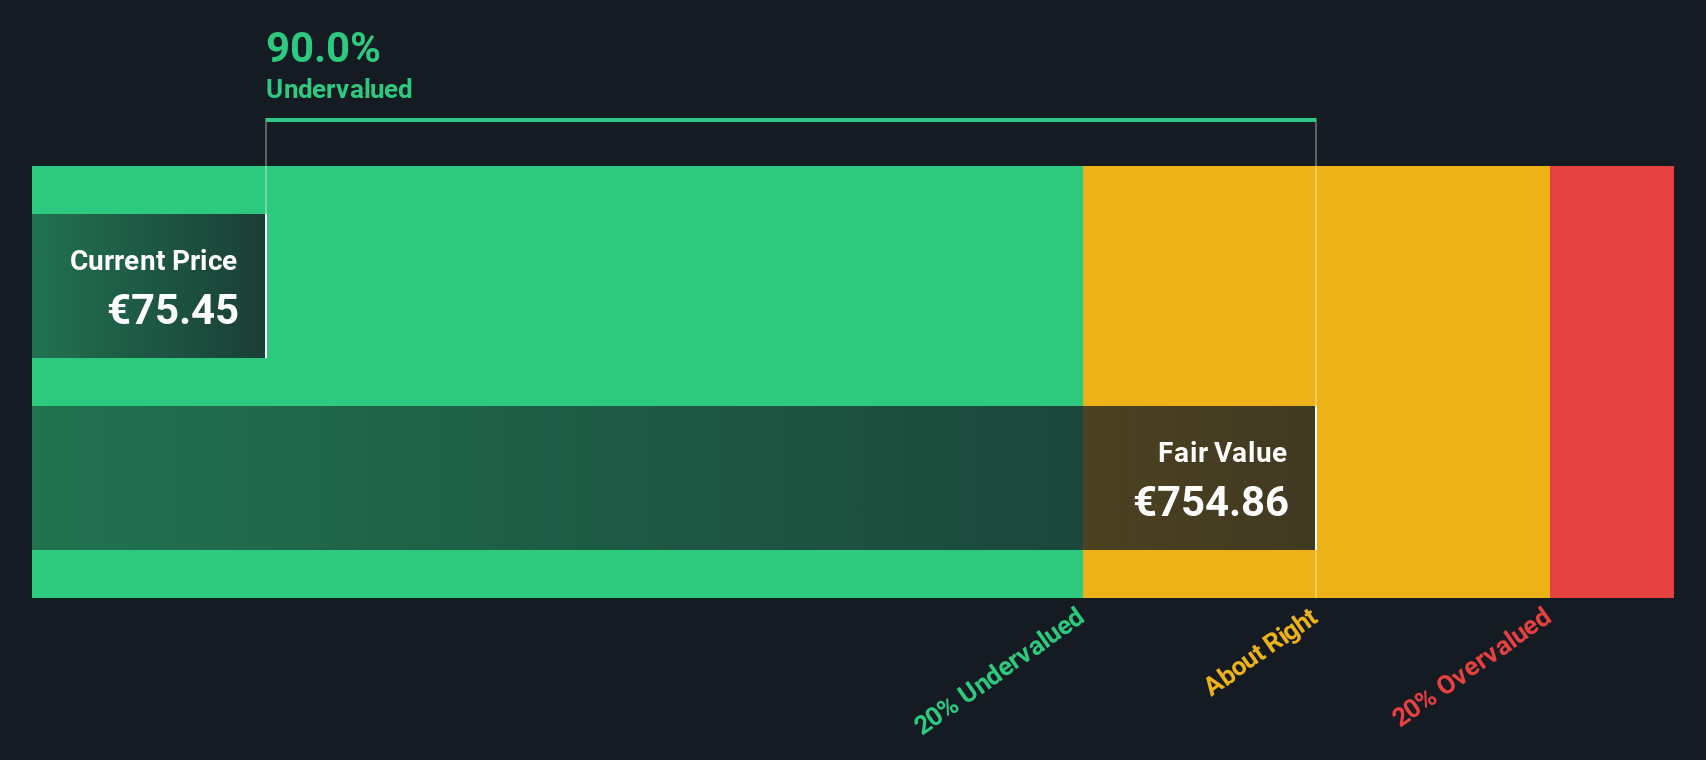
华尔街日报Exor (ENXTAM:EXO) Valuation Check After Recent Three-Month Share Price Slide
Exor (ENXTAM:EXO) has been drifting after a tough past 3 months, but that pullback is exactly what makes the stock interesting. Let us unpack what the recent slide really signals for long term investors.
See our latest analysis for Exor.
Zooming out, the share price has slipped to about $72.55 after a weak 90 day share price return, but Exor still shows a positive three year total shareholder return. This suggests long term confidence has not disappeared, just cooled.
If Exor has you rethinking your portfolio mix, it could be a good moment to broaden your search and explore auto manufacturers for other ideas riding different parts of the same ecosystem.
With shares trading well below analyst estimates despite robust earnings momentum, investors are left weighing whether Exor’s diversified portfolio is quietly mispriced or whether the market is already factoring in most of its future growth.
Price to Book of 0.4x: Is it justified?
On a price to book basis, Exor looks inexpensive at a 0.4x multiple, which is far below peers despite the recent share price weakness.
Price to book compares the market value of the company to the net value of its assets. This can be a useful lens for diversified holding companies like Exor with substantial equity stakes in underlying businesses.
At 0.4x book value versus 1x for the wider European diversified financials space and 6.2x for close peers, the market is assigning a sizable discount to Exor’s asset base. This indicates investor skepticism about future returns and capital allocation.
This steep gap to both the industry and peer averages signals that, relative to its balance sheet, Exor is priced as if its portfolio and management will deliver much weaker outcomes than comparable groups. This leaves room for sentiment to shift if execution improves.
See what the numbers say about this price — find out in our valuation breakdown.
Result: Price to book of 0.4x (UNDERVALUED)
However, persistent portfolio losses and prolonged discounts to net asset value could signal deeper structural issues, limiting any near term re-rating potential.
Find out about the key risks to this Exor narrative.
Another View on Value
Our DCF model paints an even starker picture, suggesting Exor is trading about 84% below its estimated fair value of roughly €458 per share, versus the current €72.55 price. If both book value and cash flow argue it is cheap, what is the market still worried about?
Look into how the SWS DCF model arrives at its fair value.
Simply Wall St performs a discounted cash flow (DCF) on every stock in the world every day (check out Exor for example). We show the entire calculation in full. You can track the result in your watchlist or portfolio and be alerted when this changes, or use our stock screener to discover 898 undervalued stocks based on their cash flows. If you save a screener we even alert you when new companies match - so you never miss a potential opportunity.
Build Your Own Exor Narrative
If you see the numbers differently, or would rather dig into the data yourself, you can shape a full narrative in minutes: Do it your way.
A great starting point for your Exor research is our analysis highlighting 3 key rewards and 1 important warning sign that could impact your investment decision.
Ready for more high conviction ideas?
Before you move on, put Simply Wall Street’s Screener to work so you are not leaving potential winners on the table while you focus only on Exor.
- Capture potential mispricings by zeroing in on these 898 undervalued stocks based on cash flows that strong cash flow analysis suggests the market may be overlooking right now.
- Position yourself ahead of powerful tech trends by targeting these 24 AI penny stocks that could benefit as artificial intelligence reshapes entire industries.
- Strengthen your income strategy by focusing on these 10 dividend stocks with yields > 3% that aim to combine reliable yields with resilient business models.
This article by Simply Wall St is general in nature. We provide commentary based on historical data and analyst forecasts only using an unbiased methodology and our articles are not intended to be financial advice. It does not constitute a recommendation to buy or sell any stock, and does not take account of your objectives, or your financial situation. We aim to bring you long-term focused analysis driven by fundamental data. Note that our analysis may not factor in the latest price-sensitive company announcements or qualitative material. Simply Wall St has no position in any stocks mentioned.
Have feedback on this article? Concerned about the content? Get in touch with us directly. Alternatively, email editorial-team@simplywallst.com