
 Nasdaq
 华尔街日报
华尔街日报Does DICK'S Sporting Goods Still Offer Value After Its Huge Multi Year Share Price Surge?
- Wondering if DICK'S Sporting Goods is still a buy after its huge multi year run, or if most of the upside is already priced in? You are not alone, and this is exactly what we are going to unpack.
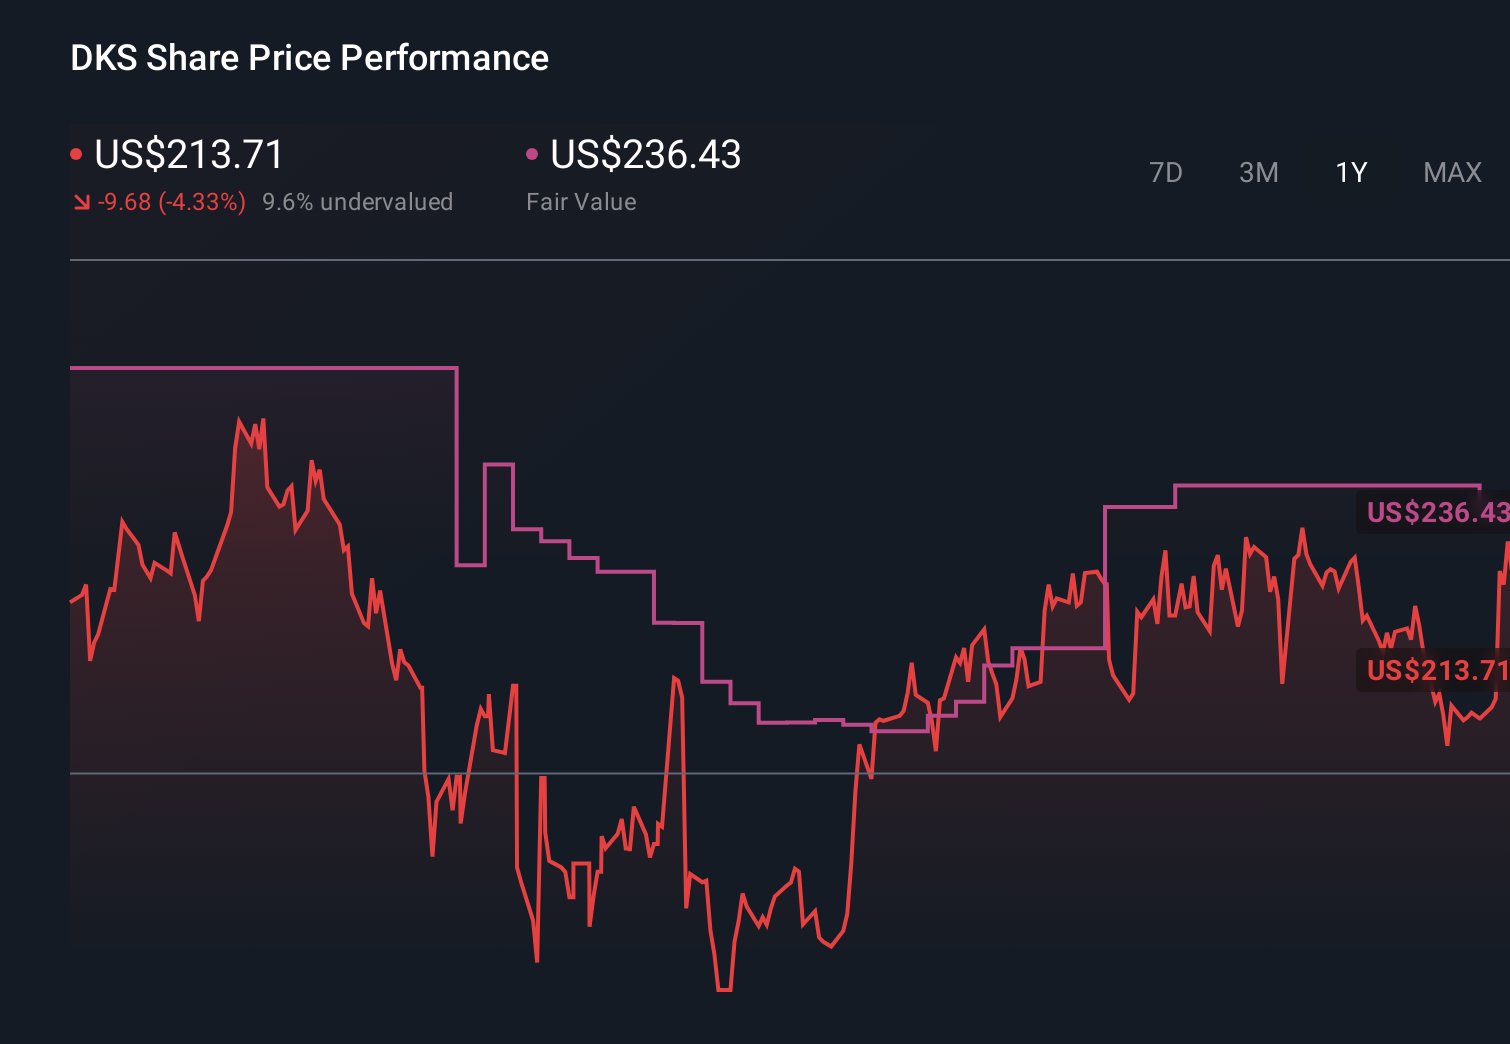
- The stock has pulled back slightly over the last week, down 0.3%, but is still up 104.6% over three years and 328.7% over five years, which naturally raises the question of how much of that growth is justified by fundamentals.
- Recent headlines have focused on the company expanding its experiential store formats and strengthening its omnichannel offering. Investors often interpret these moves as long term growth drivers rather than short term experiments. At the same time, analysts have been revisiting their long term demand assumptions for sporting goods and outdoor categories, which helps explain why the market has been willing to reward DICK'S with a richer multiple despite some recent volatility.
- On our framework of six valuation checks, DICK'S Sporting Goods currently scores a 3/6 valuation score, suggesting the market might be paying up in some areas while still overlooking value in others. Next, we will walk through the main valuation approaches investors are using today and then, at the end of this article, explore a more nuanced way to think about what the stock is really worth.
Find out why DICK'S Sporting Goods's -4.1% return over the last year is lagging behind its peers.
Approach 1: DICK'S Sporting Goods Discounted Cash Flow (DCF) Analysis
A Discounted Cash Flow model estimates what a company is worth by projecting its future cash flows and discounting them back to today, to reflect risk and the time value of money.
For DICK'S Sporting Goods, the model starts with last twelve months Free Cash Flow of about $293 million, then uses analyst forecasts and extrapolations to map out the next decade. Analysts expect Free Cash Flow to rise to roughly $507 million by fiscal 2027, with longer term projections trending in the $420 million to $440 million range by 2035, all measured in $ and remaining below the $1 billion mark.
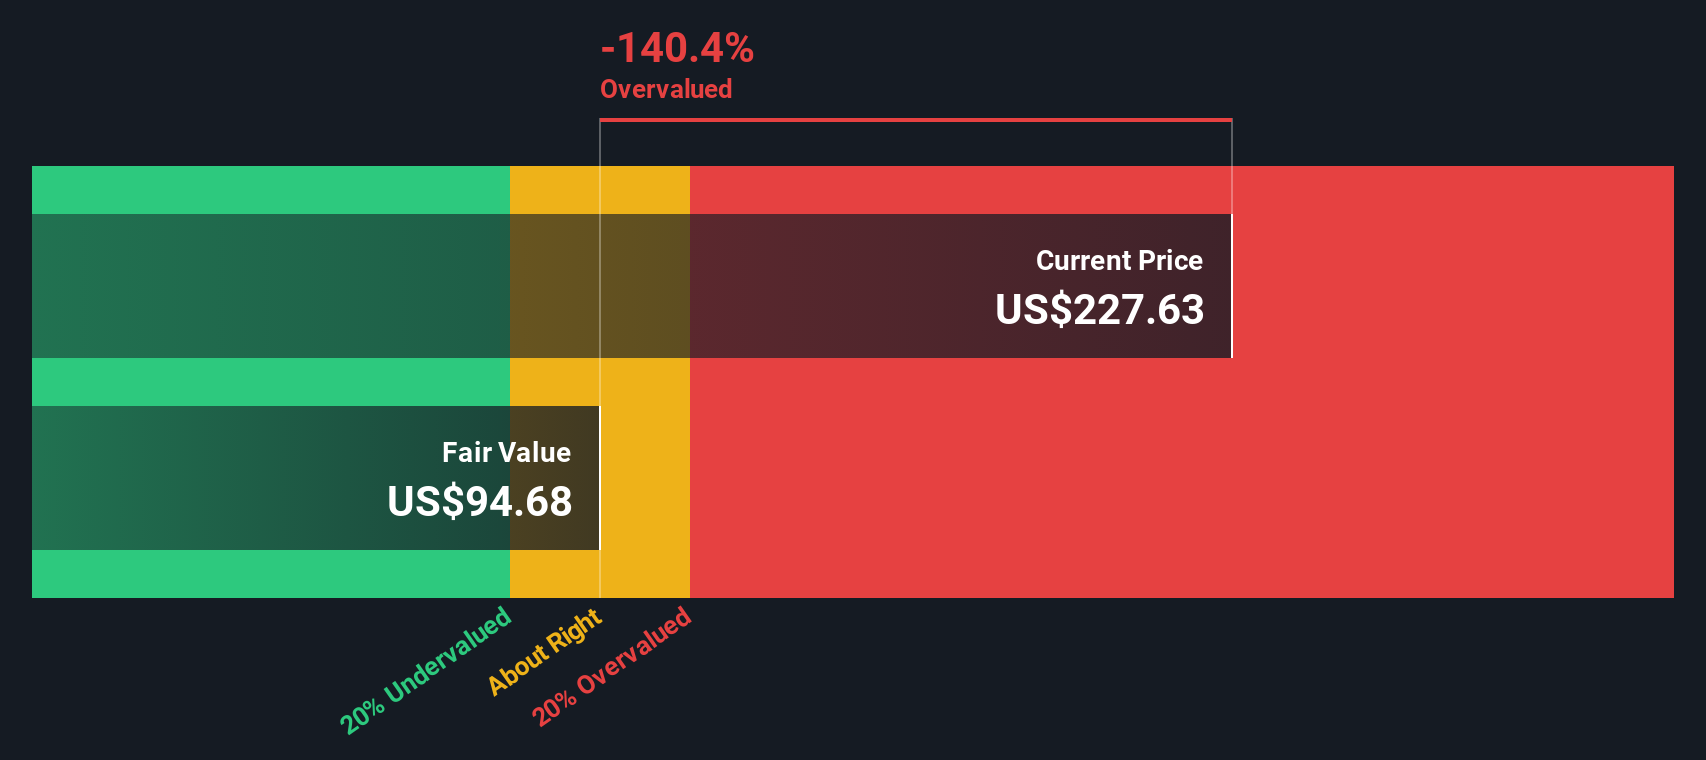
Adding up these discounted cash flows, using a 2 Stage Free Cash Flow to Equity approach, produces an estimated intrinsic value of about $66.25 per share. Compared with the current share price, this implies the stock is roughly 218.7% overvalued on a DCF basis. In other words, investors today are paying far above what the cash flow outlook alone appears to justify.
Result: OVERVALUED
Our Discounted Cash Flow (DCF) analysis suggests DICK'S Sporting Goods may be overvalued by 218.7%. Discover 898 undervalued stocks or create your own screener to find better value opportunities.
Approach 2: DICK'S Sporting Goods Price vs Earnings
For consistently profitable businesses like DICK'S Sporting Goods, the Price to Earnings ratio is often the most intuitive valuation yardstick because it directly links what investors pay today with the earnings the company is generating right now.
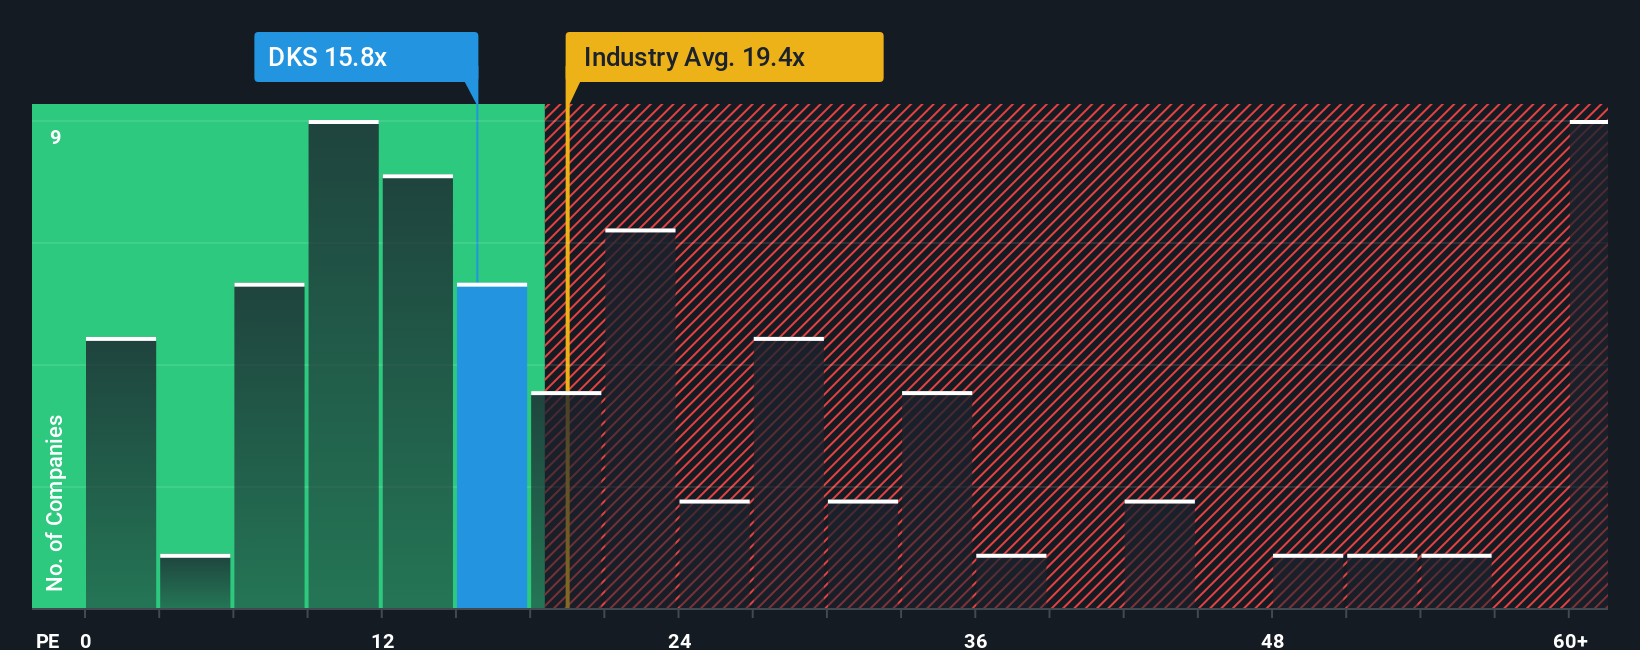
What counts as a reasonable PE, however, depends on how fast those earnings are expected to grow and how risky that growth appears. Higher growth and more predictable profits can justify a higher multiple, while slower or more volatile earnings usually demand a discount. DICK'S currently trades at about 18.6x earnings, which is a touch below the Specialty Retail industry average of roughly 20.1x and well below the 36.6x peer group average. This suggests the stock is not obviously expensive relative to its sector.
Simply Wall St also calculates a Fair Ratio of 21.1x for DICK'S, a proprietary view of what the PE should be once you factor in its specific earnings growth outlook, industry position, profit margins, market cap and risk profile. This is more tailored than simple peer or industry comparisons, which can miss important company level nuances. With the current PE of 18.6x sitting below the Fair Ratio of 21.1x, the multiple based view points to the stock being modestly undervalued.
Result: UNDERVALUED
PE ratios tell one story, but what if the real opportunity lies elsewhere? Discover 1458 companies where insiders are betting big on explosive growth.
Upgrade Your Decision Making: Choose your DICK'S Sporting Goods Narrative
Earlier we mentioned that there is an even better way to understand valuation, so let's introduce you to Narratives, a simple tool on Simply Wall St's Community page that lets you attach your own story about DICK'S Sporting Goods to the numbers. It does this by translating your assumptions about future revenue, earnings and margins into a financial forecast, linking that forecast to a Fair Value, and then comparing that Fair Value to the current share price to help you consider whether you view the stock as a buy, hold or sell. The system continuously updates your Narrative as new news or earnings arrive so your view stays current. For example, one investor might build a bullish Narrative that assumes strong long term revenue growth from omnichannel investments, higher margins and a Fair Value closer to the most optimistic analyst target around $280. A more cautious investor might emphasize Foot Locker integration risks, slower growth and margin pressure, arriving at a Fair Value nearer the most conservative target around $165. This illustrates how Narratives turn different perspectives into clear, comparable valuations that can inform your decisions over time.
Do you think there's more to the story for DICK'S Sporting Goods? Head over to our Community to see what others are saying!
This article by Simply Wall St is general in nature. We provide commentary based on historical data and analyst forecasts only using an unbiased methodology and our articles are not intended to be financial advice. It does not constitute a recommendation to buy or sell any stock, and does not take account of your objectives, or your financial situation. We aim to bring you long-term focused analysis driven by fundamental data. Note that our analysis may not factor in the latest price-sensitive company announcements or qualitative material. Simply Wall St has no position in any stocks mentioned.
Have feedback on this article? Concerned about the content? Get in touch with us directly. Alternatively, email editorial-team@simplywallst.com