
 Nasdaq
 华尔街日报
华尔街日报V & V Technology Holdings (HKG:8113) May Have Issues Allocating Its Capital
If you're looking at a mature business that's past the growth phase, what are some of the underlying trends that pop up? Businesses in decline often have two underlying trends, firstly, a declining return on capital employed (ROCE) and a declining base of capital employed. This indicates the company is producing less profit from its investments and its total assets are decreasing. So after we looked into V & V Technology Holdings (HKG:8113), the trends above didn't look too great.
Understanding Return On Capital Employed (ROCE)
For those that aren't sure what ROCE is, it measures the amount of pre-tax profits a company can generate from the capital employed in its business. To calculate this metric for V & V Technology Holdings, this is the formula:
Return on Capital Employed = Earnings Before Interest and Tax (EBIT) ÷ (Total Assets - Current Liabilities)
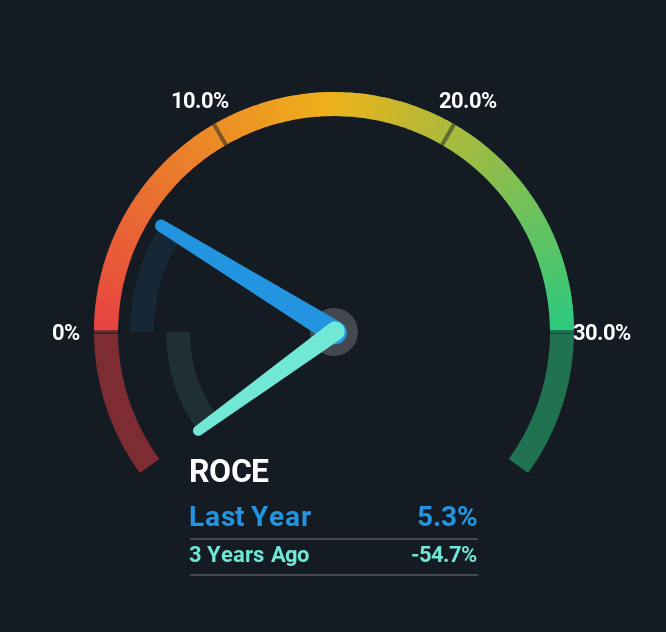
0.053 = HK$4.8m ÷ (HK$294m - HK$204m) (Based on the trailing twelve months to June 2025).
Thus, V & V Technology Holdings has an ROCE of 5.3%. In absolute terms, that's a low return and it also under-performs the Electronic industry average of 7.8%.
See our latest analysis for V & V Technology Holdings
While the past is not representative of the future, it can be helpful to know how a company has performed historically, which is why we have this chart above. If you're interested in investigating V & V Technology Holdings' past further, check out this free graph covering V & V Technology Holdings' past earnings, revenue and cash flow.
The Trend Of ROCE
We aren't too thrilled by the trend because ROCE has declined 66% over the last five years and despite the capital raising conducted before the latest reports, the business has -40% less capital employed.
On a separate but related note, it's important to know that V & V Technology Holdings has a current liabilities to total assets ratio of 69%, which we'd consider pretty high. This can bring about some risks because the company is basically operating with a rather large reliance on its suppliers or other sorts of short-term creditors. While it's not necessarily a bad thing, it can be beneficial if this ratio is lower.
The Key Takeaway
In summary, it's unfortunate that V & V Technology Holdings is shrinking its capital base and also generating lower returns. We expect this has contributed to the stock plummeting 88% during the last five years. That being the case, unless the underlying trends revert to a more positive trajectory, we'd consider looking elsewhere.
Like most companies, V & V Technology Holdings does come with some risks, and we've found 3 warning signs that you should be aware of.
If you want to search for solid companies with great earnings, check out this free list of companies with good balance sheets and impressive returns on equity.
Have feedback on this article? Concerned about the content? Get in touch with us directly. Alternatively, email editorial-team (at) simplywallst.com.
This article by Simply Wall St is general in nature. We provide commentary based on historical data and analyst forecasts only using an unbiased methodology and our articles are not intended to be financial advice. It does not constitute a recommendation to buy or sell any stock, and does not take account of your objectives, or your financial situation. We aim to bring you long-term focused analysis driven by fundamental data. Note that our analysis may not factor in the latest price-sensitive company announcements or qualitative material. Simply Wall St has no position in any stocks mentioned.