
 Nasdaq
 华尔街日报
华尔街日报Is Dominion Energy Fairly Priced After Recent Portfolio Simplification and Share Price Pullback?
- If you are wondering whether Dominion Energy is quietly trading at a discount or just fairly priced for its future, this breakdown will help you decide whether the current share price still offers value.
- The stock has slipped around 4.4% over the last week and 6.9% over the past month, but it is still up 5.2% year to date and 11.7% over the past year. This mix hints at shifting sentiment around both its growth prospects and risk profile.
- Recent headlines have focused on Dominion's ongoing portfolio simplification and regulatory updates across its key utility markets. These moves aim to streamline operations and reduce uncertainty. Investors have been weighing how these strategic shifts could influence long term cash flows and, ultimately, what they should be willing to pay for the stock.
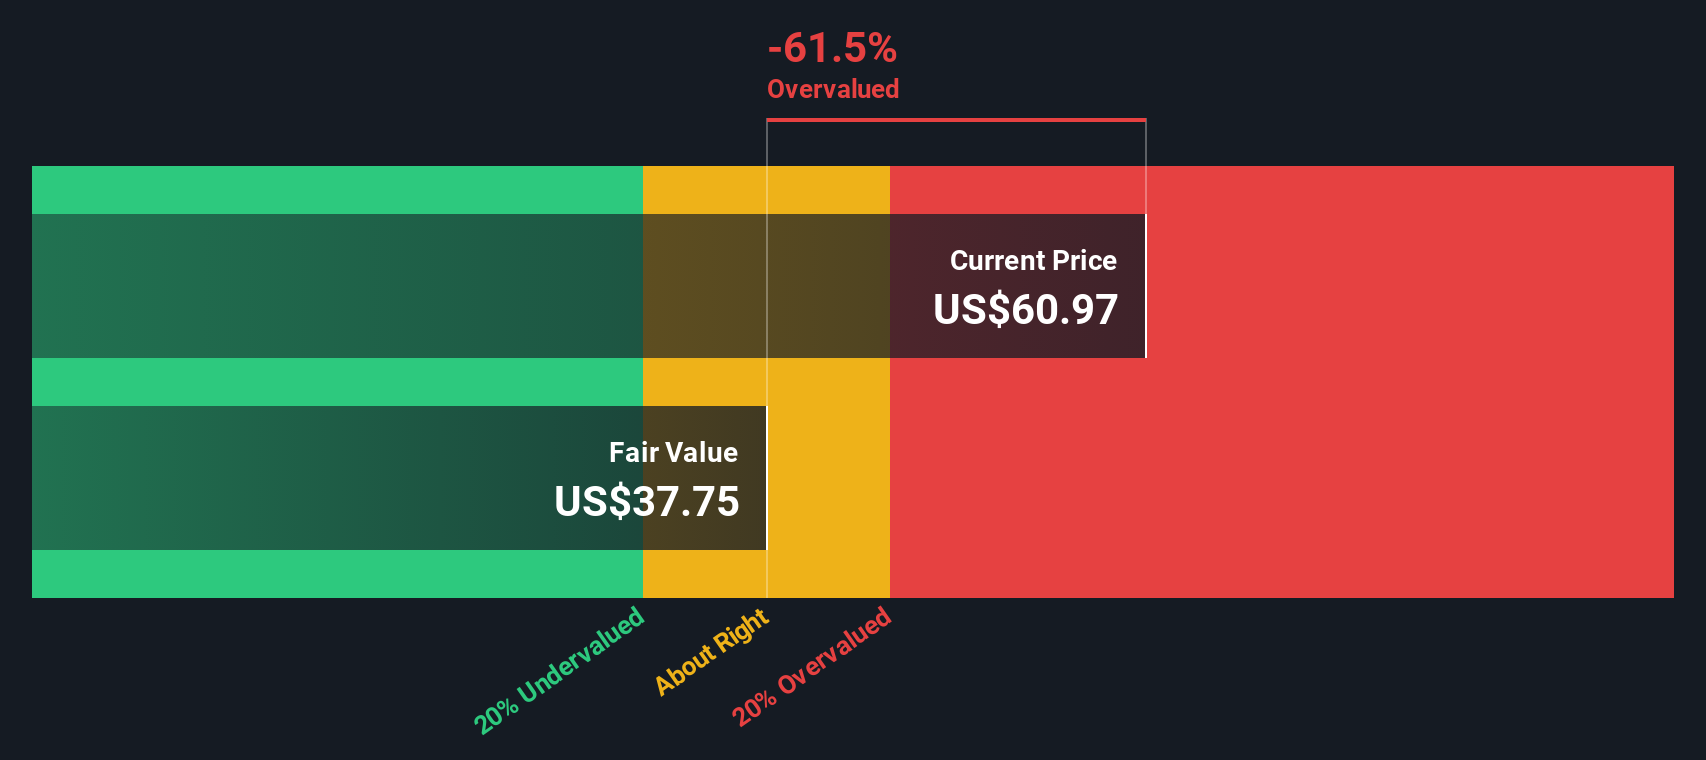
- On our checklist based valuation framework, Dominion Energy scores a 2 out of 6 for being undervalued. This suggests some upside on select measures but not a slam dunk across the board. Next we will walk through those valuation methods before exploring a more complete way to think about what the stock is really worth.
Dominion Energy scores just 2/6 on our valuation checks. See what other red flags we found in the full valuation breakdown.
Approach 1: Dominion Energy Dividend Discount Model (DDM) Analysis
The Dividend Discount Model estimates what a stock is worth by projecting all future dividend payments and discounting them back to today. It works best for stable, mature dividend payers and puts the dividend stream, rather than earnings, at the center of the valuation.
For Dominion Energy, the model uses an annual dividend per share of $2.69 and a return on equity of about 6.7%. However, the payout ratio is currently above 100% at roughly 105%, meaning dividends exceed underlying earnings. When this is fed into the DDM, it implies a slightly negative long term dividend growth rate of about 0.4%, based on the formula linking growth to retained earnings and return on equity.
On these assumptions, the DDM framework arrives at an intrinsic value of roughly $36.73 per share. When compared with the current market price, this indicates the stock is about 55.8% overvalued. This suggests investors are paying a premium for Dominion's dividend despite weak coverage and minimal growth prospects.
Result: OVERVALUED
Our Dividend Discount Model (DDM) analysis suggests Dominion Energy may be overvalued by 55.8%. Discover 899 undervalued stocks or create your own screener to find better value opportunities.
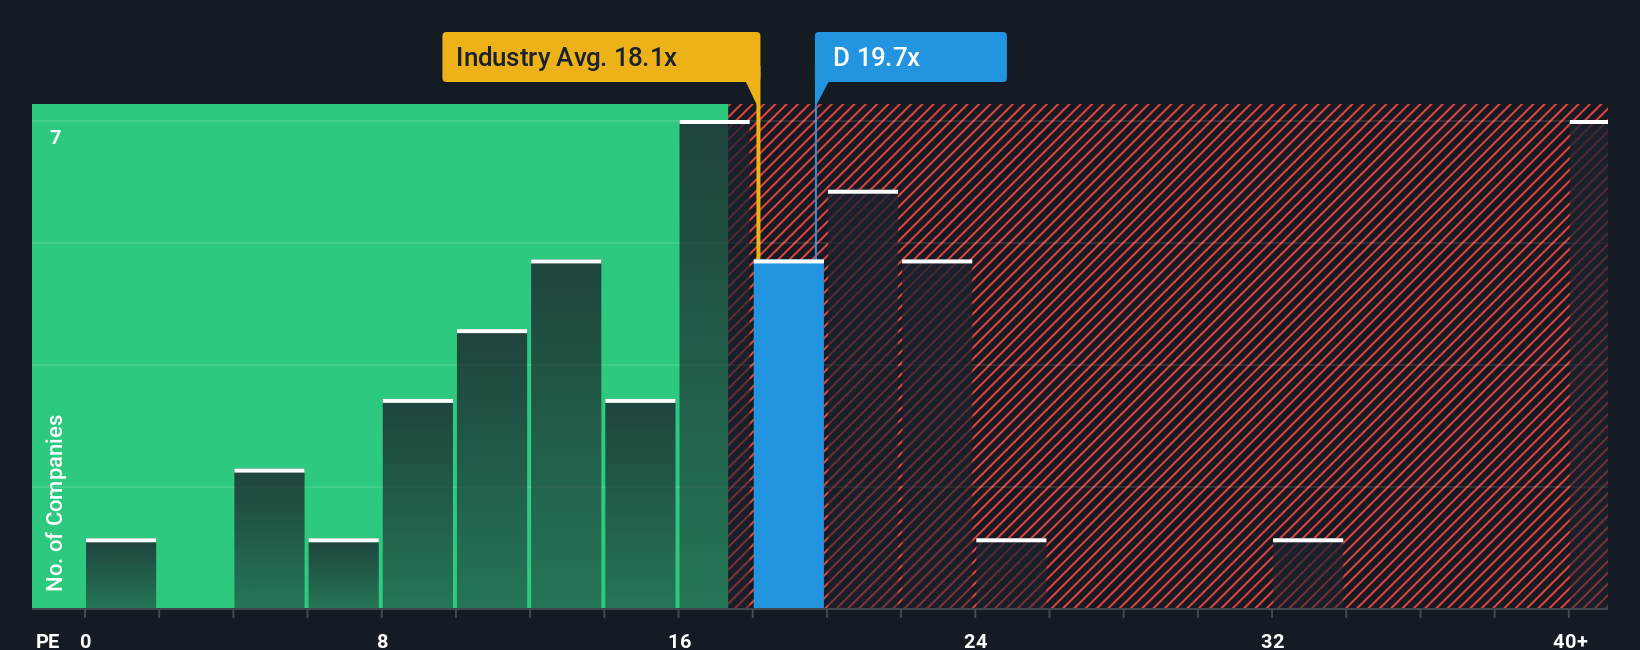
Approach 2: Dominion Energy Price vs Earnings
For companies that are consistently profitable, the price to earnings ratio is a practical way to judge valuation because it compares what investors pay with what the business actually earns. A higher or lower PE can be reasonable depending on how fast earnings are expected to grow and how risky or predictable those earnings are, so growth prospects and risk profile both shape what a normal or fair PE should look like.
Dominion Energy currently trades on a PE of about 18.7x. That is slightly above the Integrated Utilities industry average of around 17.9x, but below the broader peer group average of roughly 21.1x. Simply Wall St goes a step further by estimating a Fair Ratio of about 24.8x for Dominion, which is the PE you might expect given its earnings growth outlook, margins, industry, market value and risk factors.
This Fair Ratio is more informative than a simple peer or industry comparison because it adjusts for Dominion's specific financial profile rather than assuming all utilities deserve the same multiple. With the current PE of 18.7x sitting well below the Fair Ratio of 24.8x, the shares appear to be attractively priced on an earnings basis based on this approach.
Result: UNDERVALUED on this metric
PE ratios tell one story, but what if the real opportunity lies elsewhere? Discover 1458 companies where insiders are betting big on explosive growth.
Upgrade Your Decision Making: Choose your Dominion Energy Narrative
Earlier we mentioned that there is an even better way to understand valuation, and that is through Narratives, which let you connect a simple story about Dominion Energy with your own assumptions for future revenue, earnings, margins and fair value. You can then compare that fair value to the current share price to decide whether to buy or sell, all inside an easy to use tool on Simply Wall St's Community page that updates automatically as new news or earnings arrive. For example, a bullish investor might build a Narrative where grid modernization, renewables growth and constructive regulation justify a fair value near the highest analyst target of about $67 per share. A more cautious investor might emphasize project risks, capital intensity and regulatory uncertainty to arrive at a fair value closer to the lowest target of roughly $54. This shows how different perspectives on the same company can be translated into clear, dynamic numbers you can act on.
Do you think there's more to the story for Dominion Energy? Head over to our Community to see what others are saying!

This article by Simply Wall St is general in nature. We provide commentary based on historical data and analyst forecasts only using an unbiased methodology and our articles are not intended to be financial advice. It does not constitute a recommendation to buy or sell any stock, and does not take account of your objectives, or your financial situation. We aim to bring you long-term focused analysis driven by fundamental data. Note that our analysis may not factor in the latest price-sensitive company announcements or qualitative material. Simply Wall St has no position in any stocks mentioned.
Have feedback on this article? Concerned about the content? Get in touch with us directly. Alternatively, email editorial-team@simplywallst.com