
 Nasdaq
 华尔街日报
华尔街日报QXO (QXO) Valuation Check as Brad Jacobs Refocuses on Leadership and Analysts Turn More Bullish
QXO (QXO) just jumped about 5% in a single session after CEO Brad Jacobs shifted his attention back to the company, with upbeat Wall Street commentary and heavier institutional trading helping drive the move.
See our latest analysis for QXO.
The latest move sits on top of a powerful trend, with the share price at $21.96 after a roughly 29% one month share price return and a 12 month total shareholder return above 45 percent. This suggests momentum is building as investors warm to the Jacobs led M&A story despite a choppy repair and remodeling backdrop.
If this kind of leadership driven rerating has your attention, it could be a good moment to widen your watchlist and explore fast growing stocks with high insider ownership.
With analyst targets sitting well above the current price and growth expectations running high, the key question now is simple: is QXO still undervalued, or is the market already pricing in the next leg of Jacobs-driven expansion?
Price-to-Sales of 3.2x: Is it justified?
On a price-to-sales ratio of 3.2x at the last close of $21.96, QXO screens as expensive versus its industry and direct peers.
The price-to-sales multiple compares the company’s market value to its annual revenue, a useful lens for fast growing but currently unprofitable distributors like QXO. In this case, investors are paying a richer revenue multiple than both the broader US Trade Distributors group and similar sized peers, which implies the market is already baking in strong execution on Jacobs led growth.
Against the US Trade Distributors industry average of about 1.2x sales, QXO’s 3.2x stands out as a steep premium, and it is still above the peer average of 2.8x. Yet our SWS fair ratio work suggests the multiple could ultimately track closer to 5.4x sales, a level that would represent an even more aggressive rerating if the story continues to deliver.
Explore the SWS fair ratio for QXO
Result: Price-to-Sales of 3.2x (OVERVALUED)
However, risks remain, including QXO’s still negative net income and exposure to a cyclical repair and remodeling market that could cool faster than expected.
Find out about the key risks to this QXO narrative.
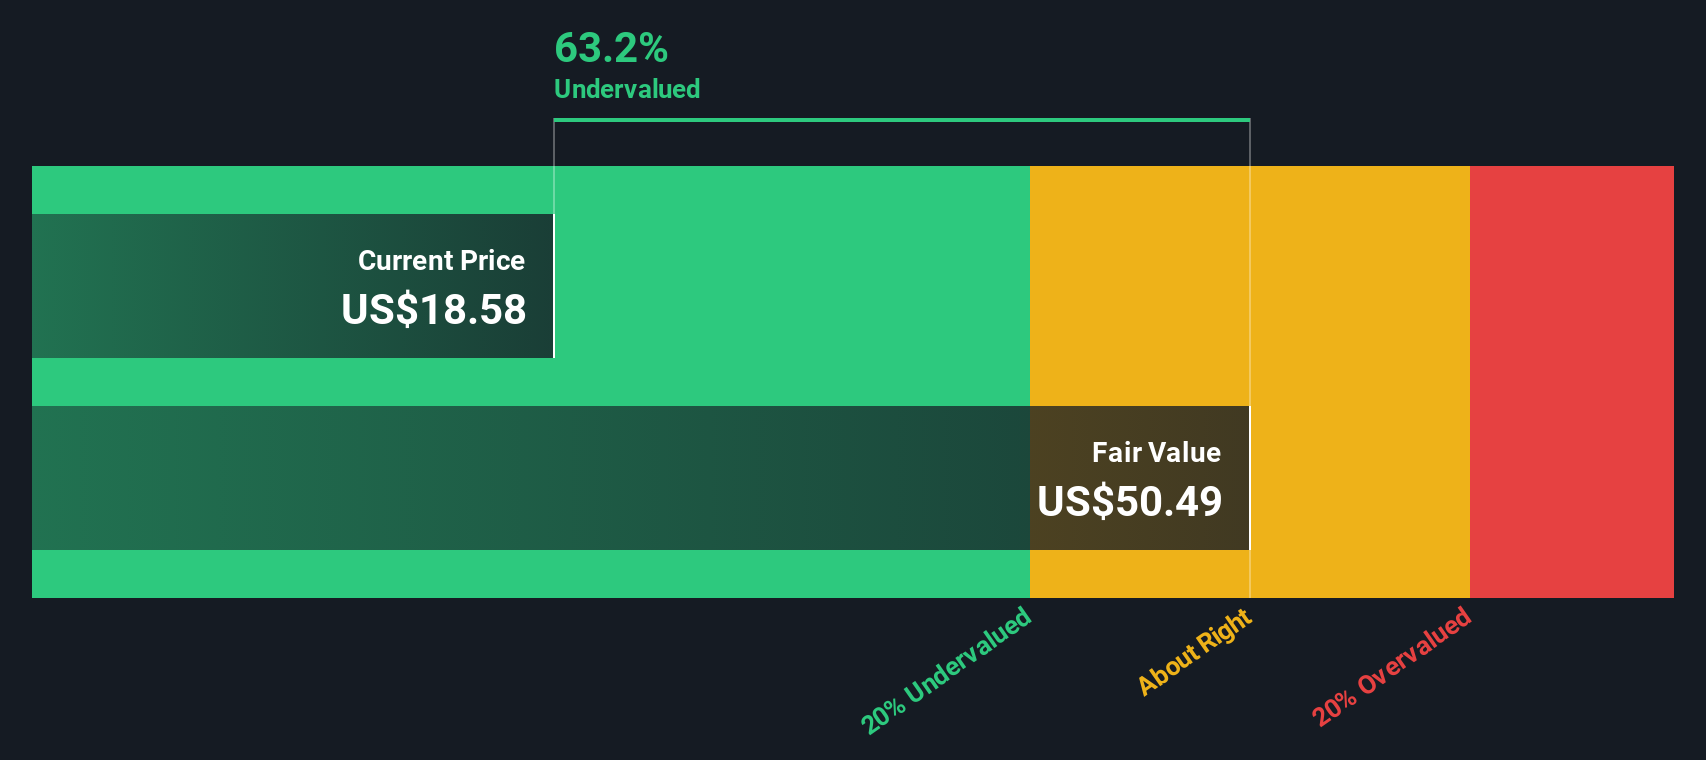
Another View: DCF Points in the Opposite Direction
While the 3.2x price to sales multiple looks stretched, our DCF model tells a very different story, suggesting QXO is trading at about a 49% discount to its estimated fair value of $43.29. If the cash flows materialise, is this rerating just getting started, or already running hot?
Look into how the SWS DCF model arrives at its fair value.
Simply Wall St performs a discounted cash flow (DCF) on every stock in the world every day (check out QXO for example). We show the entire calculation in full. You can track the result in your watchlist or portfolio and be alerted when this changes, or use our stock screener to discover 899 undervalued stocks based on their cash flows. If you save a screener we even alert you when new companies match - so you never miss a potential opportunity.
Build Your Own QXO Narrative
If you are not fully aligned with this perspective, or simply want to dig into the numbers yourself, you can build a custom view in minutes, Do it your way.
A great starting point for your QXO research is our analysis highlighting 2 key rewards and 1 important warning sign that could impact your investment decision.
Looking for more investment ideas?
Before you move on, you can scan fresh opportunities that match your style instead of waiting for the market to move without you.
- Explore potential value setups by targeting companies priced below their fundamentals using these 899 undervalued stocks based on cash flows and stay prepared for possible re-rating scenarios.
- Follow structural trends in automation and data by focusing on these 24 AI penny stocks that could influence how entire industries operate.
- Seek to strengthen your income stream with these 10 dividend stocks with yields > 3% that may offer cash returns while others pursue shorter-term themes.
This article by Simply Wall St is general in nature. We provide commentary based on historical data and analyst forecasts only using an unbiased methodology and our articles are not intended to be financial advice. It does not constitute a recommendation to buy or sell any stock, and does not take account of your objectives, or your financial situation. We aim to bring you long-term focused analysis driven by fundamental data. Note that our analysis may not factor in the latest price-sensitive company announcements or qualitative material. Simply Wall St has no position in any stocks mentioned.
Have feedback on this article? Concerned about the content? Get in touch with us directly. Alternatively, email editorial-team@simplywallst.com