
 Nasdaq
 华尔街日报
华尔街日报AGC (TSE:5201): Assessing Valuation After Major Board and Governance Reshuffle
AGC (TSE:5201) just rolled out a sweeping governance reshuffle, from multiple board and audit resignations to a planned shift to an Audit and Supervisory Committee structure. This move puts leadership continuity and oversight firmly in focus for shareholders.
See our latest analysis for AGC.
Despite the headline boardroom reshuffle, AGC’s 90 day share price return of 8.8 percent and 12.6 percent year to date suggest steadily building momentum. The 1 year total shareholder return of 20.1 percent underlines how governance moves are being weighed against improving fundamentals and earnings growth.
If this kind of strategic repositioning has you rethinking your watchlist, it could be a good moment to explore fast growing stocks with high insider ownership for other compelling ideas.
With AGC trading just below analyst targets but at a hefty discount to some intrinsic estimates, are investors still underappreciating its earnings trajectory, or is the market already pricing in the next leg of growth?
Most Popular Narrative Narrative: 1.7% Undervalued
With AGC last closing at ¥5,215 against a most popular narrative fair value of ¥5,302.50, the valuation case rests on steady growth and disciplined profitability.
The analysts have a consensus price target of ¥4758.75 for AGC based on their expectations of its future earnings growth, profit margins and other risk factors. However, there is a degree of disagreement amongst analysts, with the most bullish reporting a price target of ¥5000.0, and the most bearish reporting a price target of just ¥4200.0.
Curious how moderate growth forecasts, rising margins and a lower future earnings multiple can still justify a higher value than today? Want to see the full roadmap?
Result: Fair Value of ¥5,302.50 (UNDERVALUED)
Have a read of the narrative in full and understand what's behind the forecasts.
However, persistent weak demand in Asia and ongoing losses in Life Science could weigh on margins and prompt investors to reassess the potential upside.
Find out about the key risks to this AGC narrative.
Another Way To Look At Value
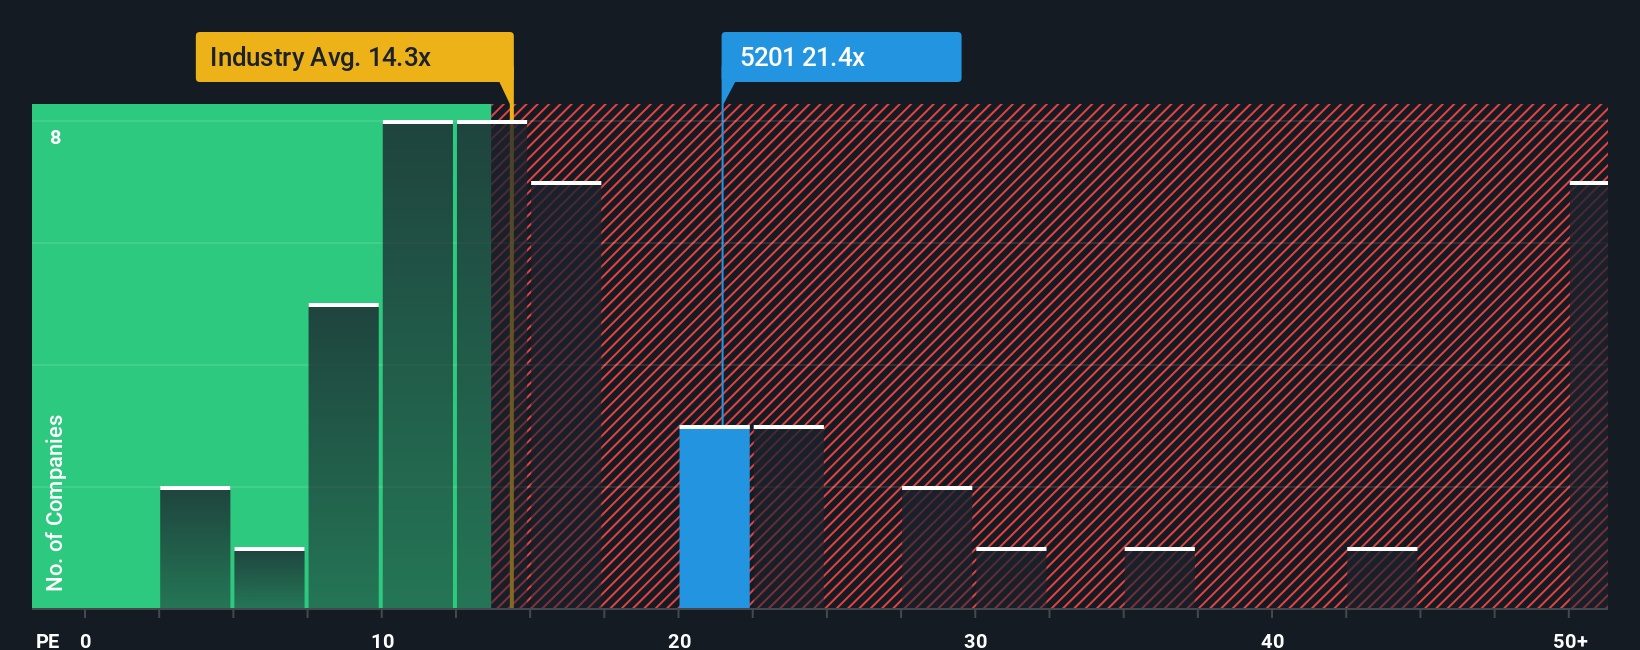
On earnings alone, AGC looks anything but cheap. Its price to earnings ratio of 21.4 times sits well above the JP Building industry at 15.4 times, even if it still trails the lofty 65.1 times peer average and a fair ratio of 23.3 times.
That gap cuts both ways, hinting at room for re rating but also less margin for error if forecasts slip. Which side of that line do you think the next earnings surprise will land on?
See what the numbers say about this price — find out in our valuation breakdown.
Build Your Own AGC Narrative
If you see the story differently or want to test your own assumptions against the numbers, you can build a custom view in just a few minutes: Do it your way.
A great starting point for your AGC research is our analysis highlighting 3 key rewards and 2 important warning signs that could impact your investment decision.
Looking for more investment ideas?
Before you move on, take a focused look at fresh opportunities on Simply Wall Street’s Screener so you do not miss the next standout performer.
- Capitalize on overlooked value by targeting companies that look attractively priced on future cash flows through these 910 undervalued stocks based on cash flows.
- Ride powerful demographic and innovation trends by zeroing in on cutting edge treatments and data driven care with these 29 healthcare AI stocks.
- Boost your income potential and reinvestment options by filtering for reliable payers using these 12 dividend stocks with yields > 3%.
This article by Simply Wall St is general in nature. We provide commentary based on historical data and analyst forecasts only using an unbiased methodology and our articles are not intended to be financial advice. It does not constitute a recommendation to buy or sell any stock, and does not take account of your objectives, or your financial situation. We aim to bring you long-term focused analysis driven by fundamental data. Note that our analysis may not factor in the latest price-sensitive company announcements or qualitative material. Simply Wall St has no position in any stocks mentioned.
Have feedback on this article? Concerned about the content? Get in touch with us directly. Alternatively, email editorial-team@simplywallst.com