
 Nasdaq
 华尔街日报
华尔街日报OMRON (TSE:6645): Assessing an Apparently Stretched Valuation After a Recent Share Price Rebound
OMRON (TSE:6645) has quietly staged a small rebound this month, even as its longer term returns remain under pressure. That gap between short term momentum and multi year weakness is where the opportunity debate starts.
See our latest analysis for OMRON.
At around ¥3,898 per share, OMRON’s 1 month share price return has nudged higher, but its 1 year total shareholder return of roughly minus 22 percent shows that longer term momentum is still clearly fading.
If OMRON’s mixed momentum has you rethinking where to seek stronger trends, this could be a good moment to explore high growth tech and AI stocks for other technology names catching investors’ attention.
With profits still growing, a sizeable discount to analyst targets and years of weak share price performance, investors now face a key question: is OMRON an undervalued recovery story, or is the market already pricing in its future growth?
Price-to-Earnings of 26.8x: Is it justified?
OMRON’s latest close at ¥3,898 equates to a 26.8x price to earnings ratio, which screens as expensive rather than a beaten down deep value opportunity.
The price to earnings multiple compares today’s share price with the company’s current earnings. It is a simple gauge of how much investors are willing to pay for each unit of profit. For an established industrial automation and electronics group like OMRON, this metric helps show whether the market is building in a premium for its expected earnings rebound or still discounting its cyclical exposure.
Right now, the market is paying more for OMRON’s earnings than both the level implied by its own fair price to earnings estimate of 22.6x and the broader Japanese Electronic industry average of 14.7x, as well as a peer average of 24.8x. That double premium suggests investors are already baking in a meaningful improvement in profitability and returns, leaving less room for upside if earnings growth or margins fall short of expectations.
Explore the SWS fair ratio for OMRON
Result: Price-to-Earnings of 26.8x (OVERVALUED)
However, weaker than expected automation demand or margin pressure from pricing and competition could undermine the case for a smooth earnings recovery.
Find out about the key risks to this OMRON narrative.
Another View: Cash Flows Tell a Sharper Story
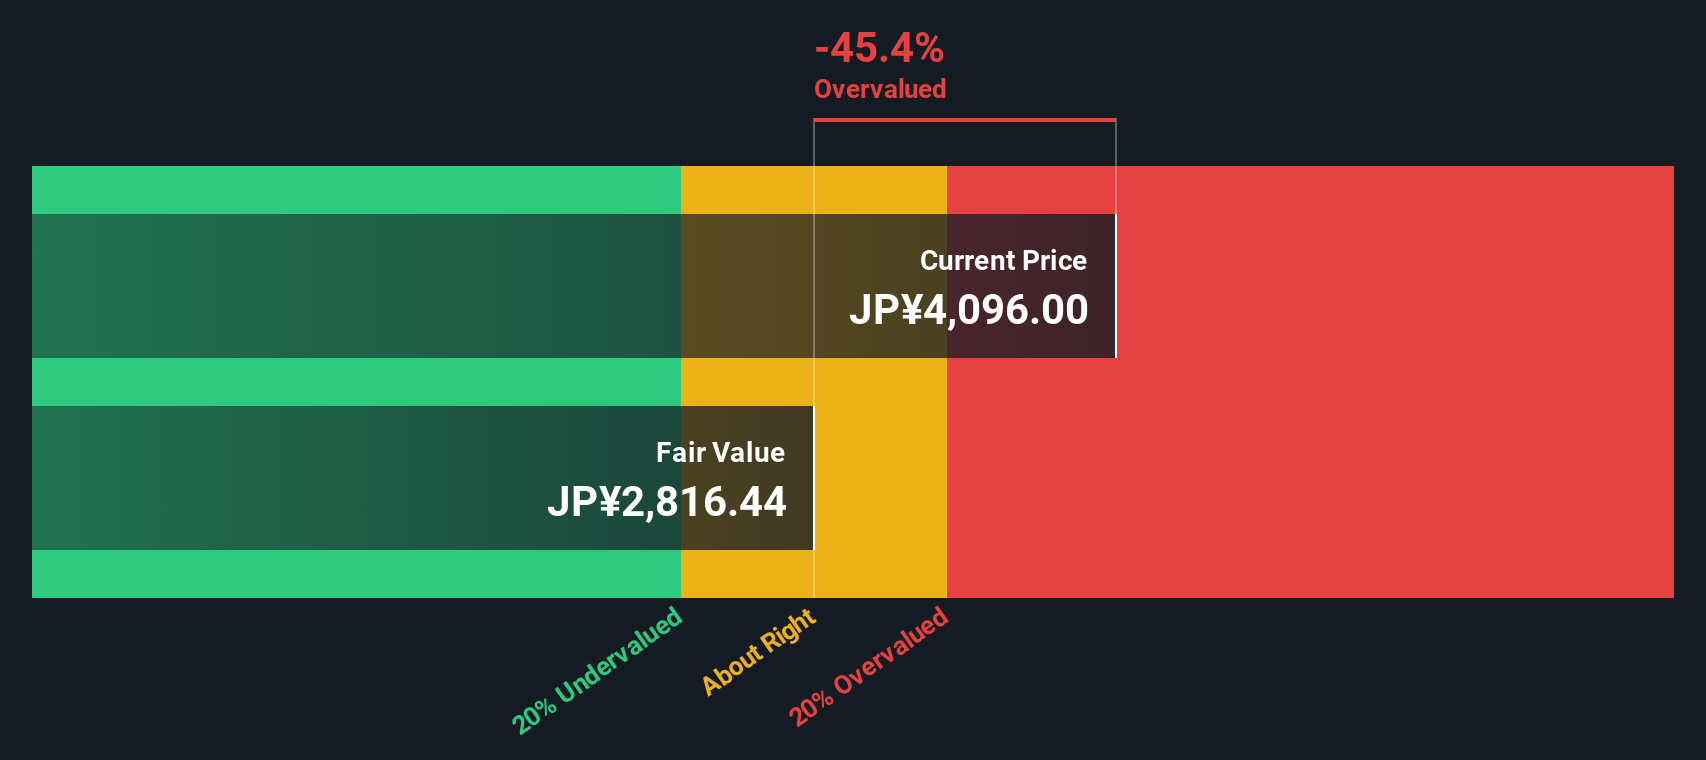
Our DCF model paints an even starker picture, suggesting fair value closer to ¥2,549 versus today’s ¥3,898, implying OMRON looks overvalued on both earnings and cash flow. If both lenses flash caution, is the recent rebound a trap or the start of a rerating?
Look into how the SWS DCF model arrives at its fair value.
Simply Wall St performs a discounted cash flow (DCF) on every stock in the world every day (check out OMRON for example). We show the entire calculation in full. You can track the result in your watchlist or portfolio and be alerted when this changes, or use our stock screener to discover 913 undervalued stocks based on their cash flows. If you save a screener we even alert you when new companies match - so you never miss a potential opportunity.
Build Your Own OMRON Narrative
If you see the story differently, or want to stress test our view with your own assumptions, you can build a tailored perspective in minutes: Do it your way.
A great starting point for your OMRON research is our analysis highlighting 2 key rewards and 2 important warning signs that could impact your investment decision.
Looking for more investment ideas?
Before you move on, lock in your next opportunity by using the Simply Wall Street Screener to uncover focused, high conviction ideas that others might overlook.
- Capture powerful long term compounding potential by scanning these 12 dividend stocks with yields > 3% offering reliable income alongside room for growth.
- Target fast moving innovation by reviewing these 24 AI penny stocks that could reshape industries with transformational technology.
- Strengthen your margin of safety by zeroing in on these 913 undervalued stocks based on cash flows where market pessimism may have gone too far.
This article by Simply Wall St is general in nature. We provide commentary based on historical data and analyst forecasts only using an unbiased methodology and our articles are not intended to be financial advice. It does not constitute a recommendation to buy or sell any stock, and does not take account of your objectives, or your financial situation. We aim to bring you long-term focused analysis driven by fundamental data. Note that our analysis may not factor in the latest price-sensitive company announcements or qualitative material. Simply Wall St has no position in any stocks mentioned.
Have feedback on this article? Concerned about the content? Get in touch with us directly. Alternatively, email editorial-team@simplywallst.com