
 Nasdaq
 华尔街日报
华尔街日报Is It Too Late To Buy Valero After Its 250% Five Year Surge?
- If you are wondering whether Valero Energy at around $162 a share is still good value after its huge run, or if you would be buying in too late, this article will walk through that question step by step.
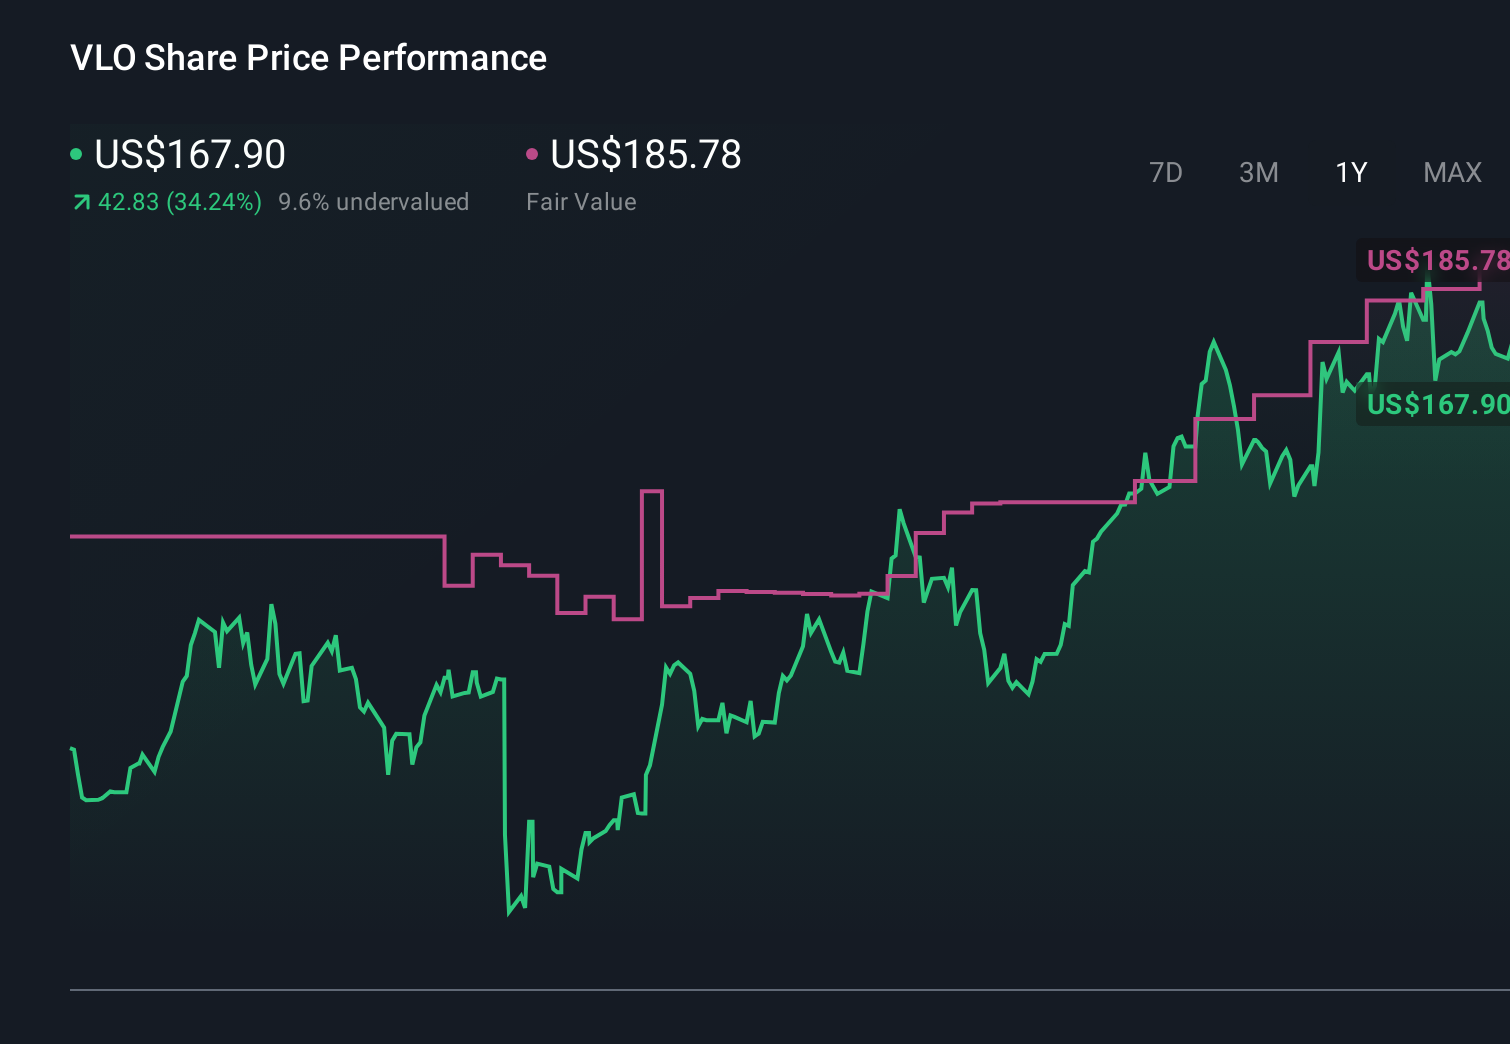
- Even after a recent pullback of about 3.3% over the last week and 6.2% over the last month, the stock is still up 32.1% year to date and 41.5% over the last year, with a 250.6% gain over five years.
- Those moves have been supported by a strong refining backdrop, including robust crack spreads and resilient global fuel demand, as well as ongoing capital returns through dividends and buybacks. At the same time, the market is digesting long term questions around refining capacity, regulatory shifts, and the energy transition, which can amplify short term swings in sentiment.
- Based on our numbers, Valero Energy currently scores a 2 out of 6 on our valuation checks. This suggests there may be some pockets of value but also areas where the market might be paying up. Next, we will break that down using different valuation approaches, before finishing with a more holistic way to think about what the stock may be worth.
Valero Energy scores just 2/6 on our valuation checks. See what other red flags we found in the full valuation breakdown.
Approach 1: Valero Energy Discounted Cash Flow (DCF) Analysis
A Discounted Cash Flow, or DCF, model estimates what a business is worth by projecting the cash it can generate in the future and then discounting those cash flows back to today’s dollars.
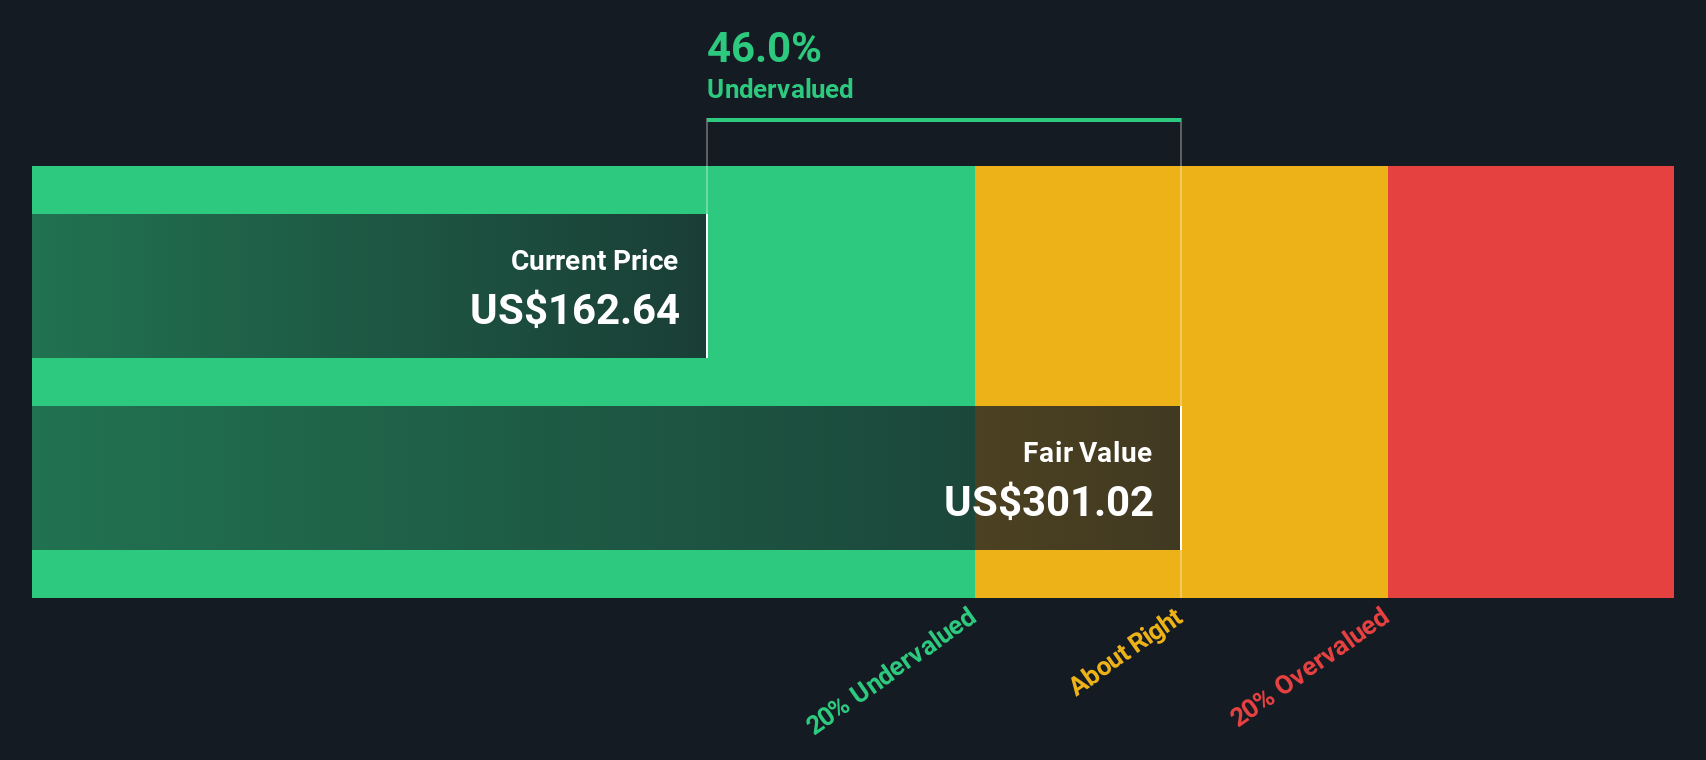
For Valero Energy, this approach starts with last twelve months Free Cash Flow of about $4.0 billion. Analysts provide explicit forecasts out to 2027, with projected Free Cash Flow of roughly $3.7 billion in that year. Simply Wall St then extrapolates a gradual evolution in cash flows over the following years, with estimates staying in the $3.6 to $4.1 billion range by 2035. These projections are discounted using a 2 Stage Free Cash Flow to Equity model to reflect the risk and time value of money.
On this basis, the estimated intrinsic value comes out at about $279.60 per share, compared with a current share price around $162. That implies the stock is about 41.8% undervalued according to this DCF view.
Result: UNDERVALUED
Our Discounted Cash Flow (DCF) analysis suggests Valero Energy is undervalued by 41.8%. Track this in your watchlist or portfolio, or discover 914 more undervalued stocks based on cash flows.
Approach 2: Valero Energy Price vs Earnings
For a consistently profitable company like Valero Energy, the price to earnings (PE) ratio is a useful way to gauge how much investors are willing to pay for each dollar of current earnings. A higher PE typically reflects stronger growth expectations or lower perceived risk, while a lower PE suggests more modest growth or higher uncertainty. What counts as a fair PE depends on these factors.
Valero currently trades on a PE of about 33.3x, which is well above both the Oil and Gas industry average of roughly 12.8x and the broader peer group average of around 24.7x. Simply Wall St also calculates a proprietary Fair Ratio of 22.9x for Valero, which estimates what its PE should be after accounting for its earnings growth profile, profitability, size, industry characteristics, and specific risks.
Because the Fair Ratio is tailored to Valero’s fundamentals rather than just simple comparisons, it provides a more nuanced benchmark than industry or peer averages alone. With the actual PE of 33.3x sitting materially above the Fair Ratio of 22.9x, this approach suggests the shares are pricing in more optimism than the fundamentals justify.
Result: OVERVALUED
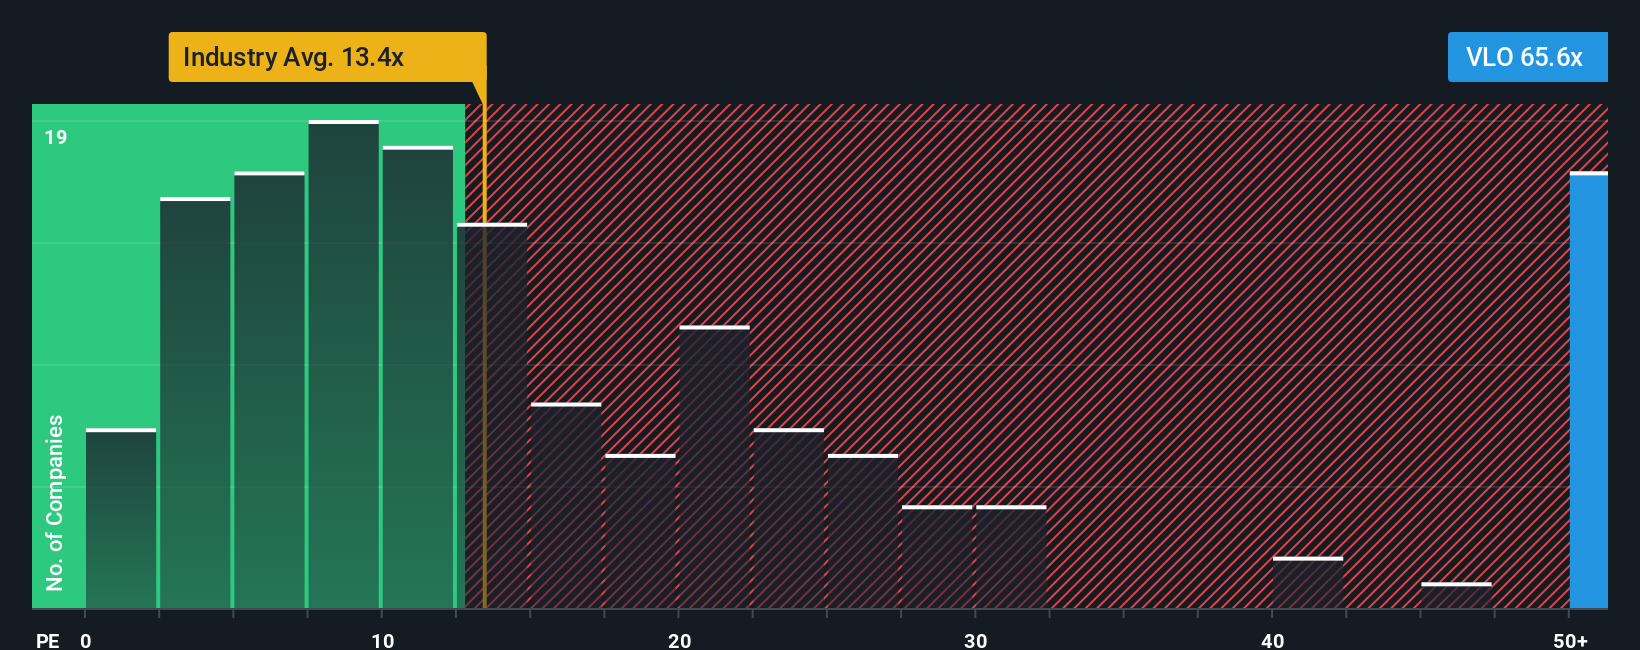
PE ratios tell one story, but what if the real opportunity lies elsewhere? Discover 1462 companies where insiders are betting big on explosive growth.
Upgrade Your Decision Making: Choose your Valero Energy Narrative
Earlier we mentioned that there is an even better way to understand valuation, so let us introduce you to Narratives, a simple way to connect your view of Valero Energy’s story with a concrete forecast and a Fair Value estimate. A Narrative is your own structured storyline for the company, where you spell out how you think revenue, earnings and margins will evolve, and the platform turns that into projected financials and a Fair Value that you can directly compare to today’s share price to decide whether you see Valero as a buy, hold or sell. Narratives on Simply Wall St, available to millions of investors via the Community page, are easy to set up, update automatically when new news or earnings arrive, and make it clear how changes in refining margins, capital returns or regulation feed through to future cash flows and valuation. For example, one Valero Narrative might assume stronger refining margins and capital returns, landing on a Fair Value closer to $186 per share, while a more cautious Narrative focused on regulatory and renewable risks could support a Fair Value nearer $133, and the difference between those views becomes a transparent, data backed discussion instead of a vague debate.
Do you think there's more to the story for Valero Energy? Head over to our Community to see what others are saying!
This article by Simply Wall St is general in nature. We provide commentary based on historical data and analyst forecasts only using an unbiased methodology and our articles are not intended to be financial advice. It does not constitute a recommendation to buy or sell any stock, and does not take account of your objectives, or your financial situation. We aim to bring you long-term focused analysis driven by fundamental data. Note that our analysis may not factor in the latest price-sensitive company announcements or qualitative material. Simply Wall St has no position in any stocks mentioned.
Have feedback on this article? Concerned about the content? Get in touch with us directly. Alternatively, email editorial-team@simplywallst.com