
 Nasdaq
 华尔街日报
华尔街日报Is SM Energy Mispriced After a 53.5% Share Price Slide?
- If you are wondering whether SM Energy is a bargain or a value trap at today’s price, you are not alone. This article unpacks what the current market is implying.
- Despite a tough year to date, with the stock down around 53.5% and roughly 47.4% over the last 12 months, the longer-term picture still shows a 232.8% gain over five years, which highlights both sizable upside potential and elevated risk.
- Much of this volatility has been driven by shifting expectations around oil and gas prices, along with changing investor appetite for independent exploration and production companies, which can quickly swing from favored to shunned. Recent commentary in the sector has focused on capital discipline, debt reduction, and how efficiently companies like SM Energy can convert higher commodity prices into sustainable free cash flow. All of these factors feed directly into how the market values the stock.
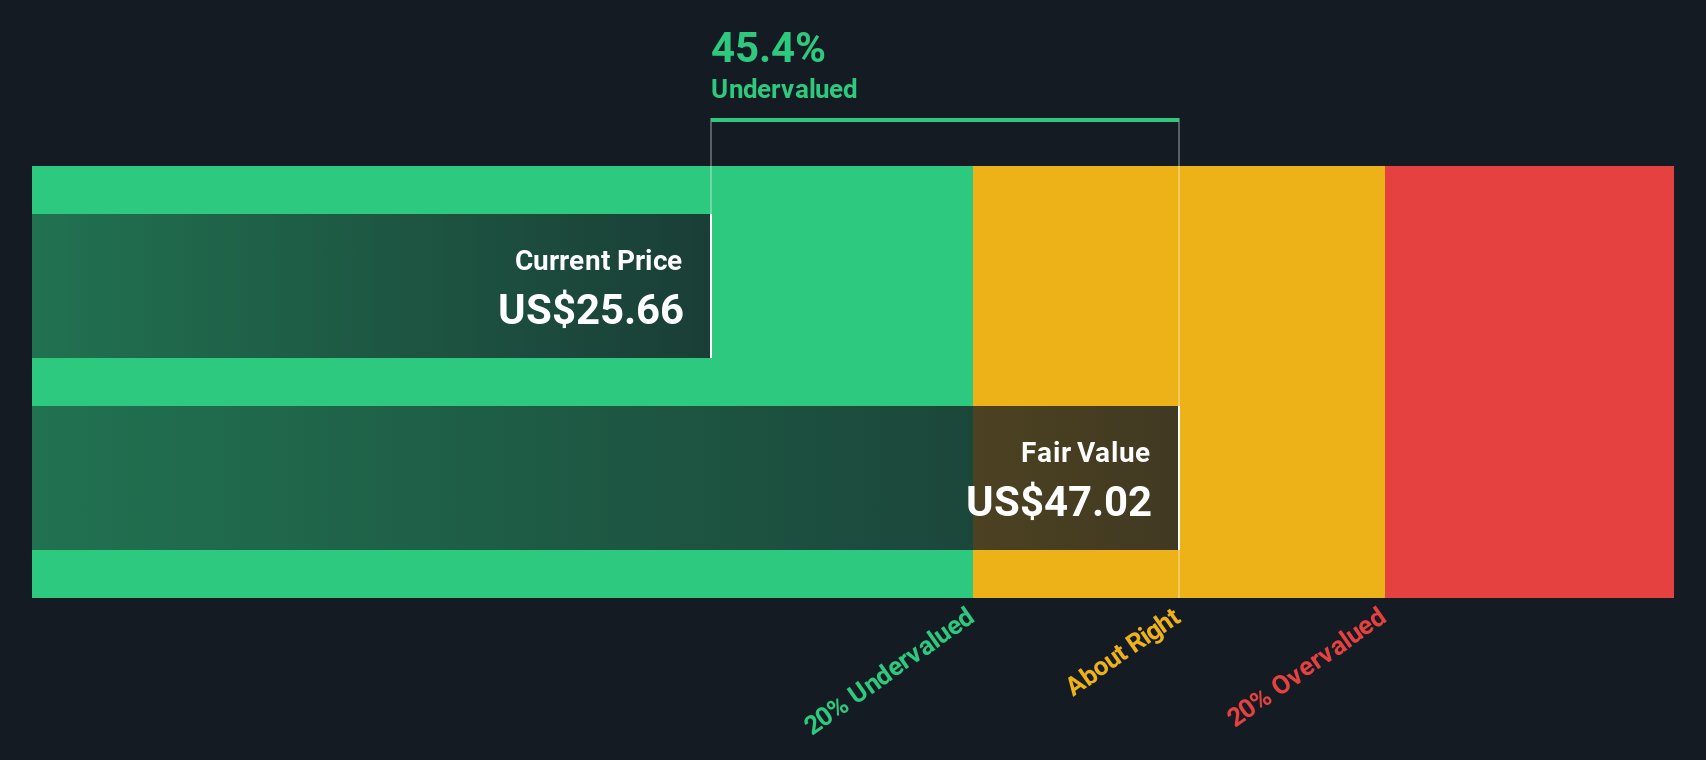
- Within our framework, SM Energy scores a 5/6 valuation check, suggesting it appears undervalued on most of the key metrics we track. Next, we will walk through those different valuation approaches before circling back to a more comprehensive way to think about what the stock may be worth.
Find out why SM Energy's -47.4% return over the last year is lagging behind its peers.
Approach 1: SM Energy Discounted Cash Flow (DCF) Analysis
A Discounted Cash Flow model estimates what a company is worth by projecting the cash it can generate in the future and discounting those cash flows back to today’s dollars. For SM Energy, this uses a 2 stage Free Cash Flow to Equity approach based on analyst forecasts and then extrapolated estimates.
SM Energy’s last twelve months Free Cash Flow was a negative $307.4 Million, reflecting recent investment and commodity price volatility. Analysts cited in the model expect a sharp swing higher, with projected Free Cash Flow of about $1.72 Billion by 2028. Beyond that, Simply Wall St extrapolates cash flows that continue to grow modestly through 2035, staying well above $1.7 Billion a year in today’s terms.
When all those future cash flows are discounted back, the model estimates an intrinsic value of about $262 per share. Compared with the current share price, this output implies the stock is roughly 92.9% undervalued, indicating that the model suggests the market is heavily discounting SM Energy’s future cash generation.
Result: UNDERVALUED
Our Discounted Cash Flow (DCF) analysis suggests SM Energy is undervalued by 92.9%. Track this in your watchlist or portfolio, or discover 914 more undervalued stocks based on cash flows.
Approach 2: SM Energy Price vs Earnings
For companies that are consistently profitable, the Price to Earnings, or PE, ratio is often the cleanest way to see how much investors are paying for each dollar of current earnings. What counts as a normal PE depends on how fast those earnings are expected to grow and how risky or cyclical the business is, with higher growth and lower perceived risk usually justifying a higher multiple.
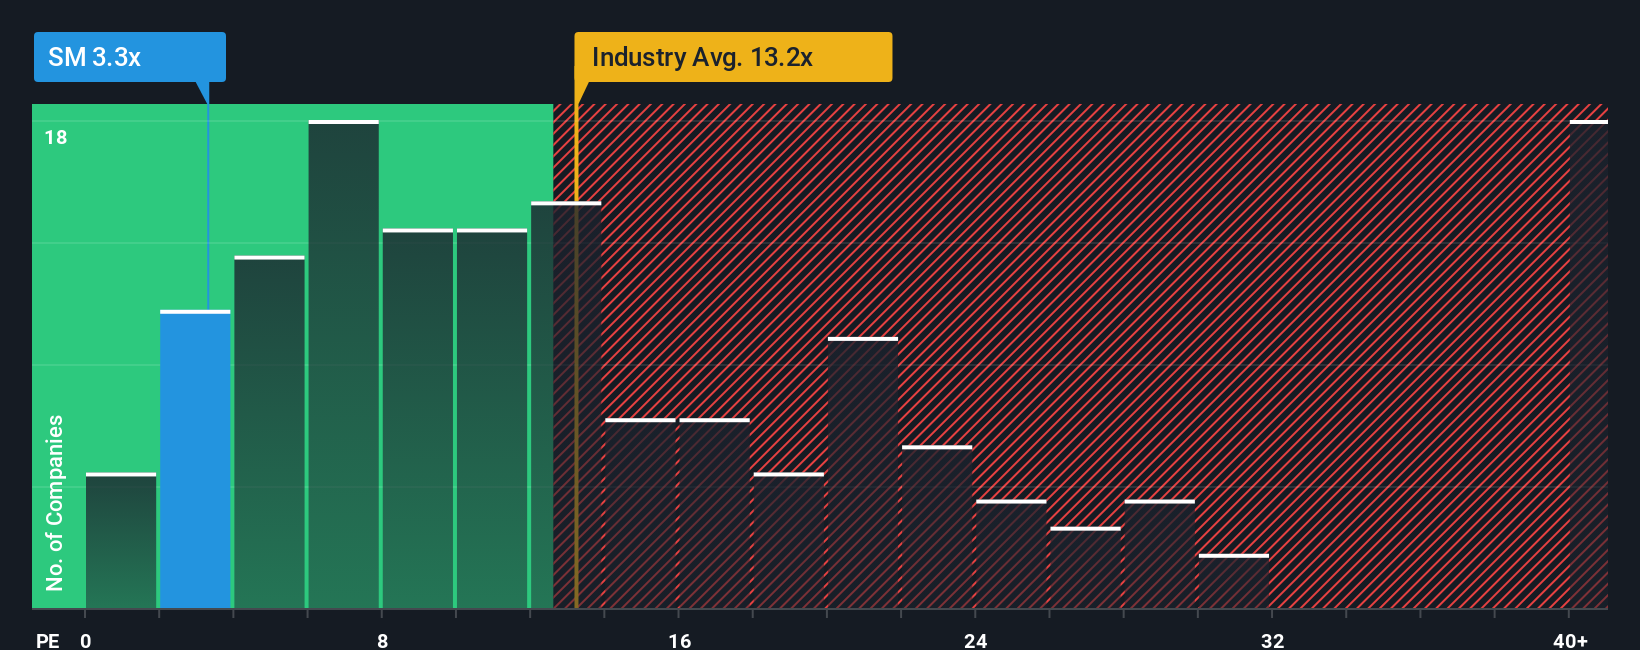
SM Energy currently trades on a PE of about 2.94x, which is far below both the Oil and Gas industry average of roughly 12.77x and an even higher peer group average of around 29.98x. On the surface, that kind of discount suggests investors are heavily discounting future earnings durability or are worried about commodity price swings.
Simply Wall St also calculates a Fair Ratio of 15.04x, a proprietary PE estimate that reflects SM Energy’s specific growth outlook, profitability, risk profile, industry positioning, and market cap. This tailored benchmark is more informative than simple peer or industry comparisons because it adjusts for the company’s own strengths and vulnerabilities. Comparing the current 2.94x PE to the 15.04x Fair Ratio points to SM Energy trading well below what its fundamentals would typically warrant, which may indicate meaningful upside if earnings hold up.
Result: UNDERVALUED
PE ratios tell one story, but what if the real opportunity lies elsewhere? Discover 1463 companies where insiders are betting big on explosive growth.
Upgrade Your Decision Making: Choose your SM Energy Narrative
Earlier we mentioned that there is an even better way to understand valuation, so let us introduce you to Narratives, a simple way to connect your view of SM Energy’s story with your own forecast for revenue, earnings, margins, and ultimately fair value. A Narrative is the story behind your numbers, linking what you believe about SM Energy’s assets, risks, and opportunities to a structured financial forecast, which then produces a fair value you can directly compare with today’s share price to decide whether to buy, hold, or sell. On Simply Wall St, Narratives live in the Community page, where millions of investors can build and share these story plus forecast views, and they update dynamically as new information, like merger news or updated production guidance, comes in. For example, one SM Energy Narrative might lean into operational efficiencies, robust free cash flow, and merger optionality to justify a higher fair value near 59 dollars, while a more cautious Narrative could focus on basin concentration, regulatory risk, and shrinking margins to anchor a lower fair value closer to 27 dollars.
Do you think there's more to the story for SM Energy? Head over to our Community to see what others are saying!
This article by Simply Wall St is general in nature. We provide commentary based on historical data and analyst forecasts only using an unbiased methodology and our articles are not intended to be financial advice. It does not constitute a recommendation to buy or sell any stock, and does not take account of your objectives, or your financial situation. We aim to bring you long-term focused analysis driven by fundamental data. Note that our analysis may not factor in the latest price-sensitive company announcements or qualitative material. Simply Wall St has no position in any stocks mentioned.
Have feedback on this article? Concerned about the content? Get in touch with us directly. Alternatively, email editorial-team@simplywallst.com