
 Nasdaq
 华尔街日报
华尔街日报Does Catalyst Pharmaceuticals Rally Still Offer Value After 594% Five Year Surge?
- Wondering if Catalyst Pharmaceuticals is still a smart buy after its huge multi year run, or if most of the upside is already priced in? This breakdown will help you consider whether the current share price offers real value or is primarily driven by momentum.
- The stock has continued to grind higher, with gains of 0.5% over the last week, 2.0% over the last month, 10.3% year to date, 11.6% over the past year, and 594.2% over five years.
- Recent market interest has been shaped by the company expanding its rare disease portfolio and advancing its pipeline, reinforcing the story that Catalyst wants to be seen as more than a single drug play. At the same time, shifting sentiment around specialty pharma and regulatory risk has kept investors focused on how durable those cash flows may be.
- On our valuation framework, Catalyst scores a 6/6 for being undervalued across all checks. Next, we will look at what different valuation approaches indicate about the stock today, and then finish with a more intuitive way to think about its worth beyond the numbers.
Find out why Catalyst Pharmaceuticals's 11.6% return over the last year is lagging behind its peers.
Approach 1: Catalyst Pharmaceuticals Discounted Cash Flow (DCF) Analysis
A Discounted Cash Flow, or DCF model, estimates what a business is worth today by projecting its future cash flows and then discounting those back to a present value. For Catalyst Pharmaceuticals, the model starts with last twelve month Free Cash Flow of about $151.7 million and uses analyst forecasts for the next few years, then extends those trends further out using Simply Wall St estimates.
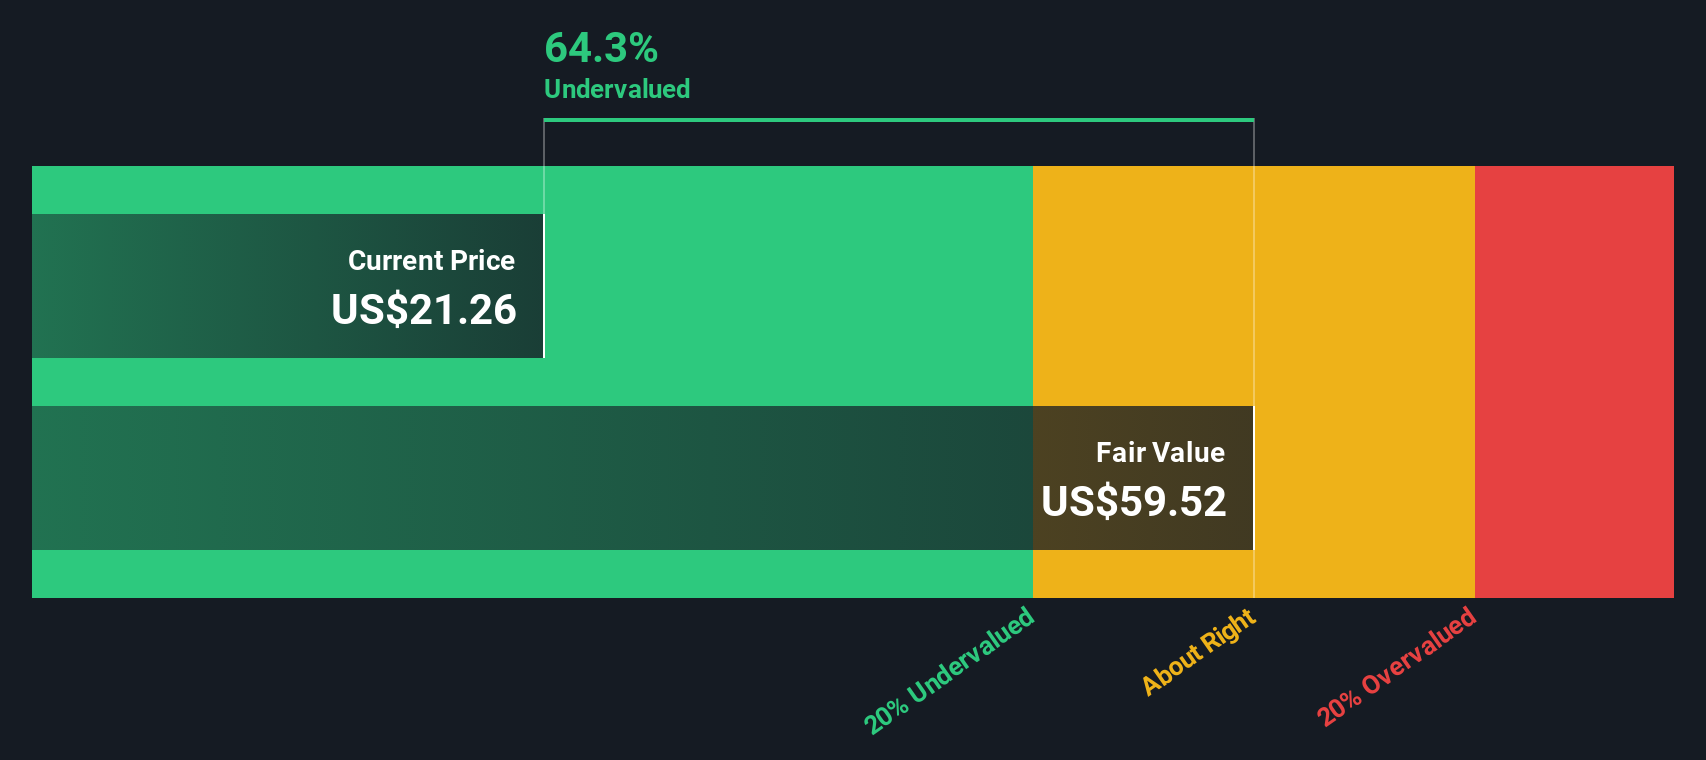
Under this 2 Stage Free Cash Flow to Equity approach, Free Cash Flow is projected to rise to roughly $374.6 million by 2035, reflecting a steady but moderating growth profile as the company matures. All these future cash flows are discounted back to today and summed to arrive at an estimated intrinsic value of about $60.13 per share.
Compared with the current market price, this indicates the stock is about 60.5% undervalued according to the DCF workup. This interpretation suggests that investors may not be fully pricing in the expected cash generation from Catalyst’s rare disease portfolio.
Result: UNDERVALUED
Our Discounted Cash Flow (DCF) analysis suggests Catalyst Pharmaceuticals is undervalued by 60.5%. Track this in your watchlist or portfolio, or discover 914 more undervalued stocks based on cash flows.
Approach 2: Catalyst Pharmaceuticals Price vs Earnings
For profitable companies like Catalyst Pharmaceuticals, the price to earnings, or PE, ratio is a useful way to gauge how much investors are willing to pay today for a dollar of current earnings. In general, faster expected growth and lower perceived risk can justify a higher PE multiple, while slower growth or higher risk usually call for a lower, more conservative multiple.
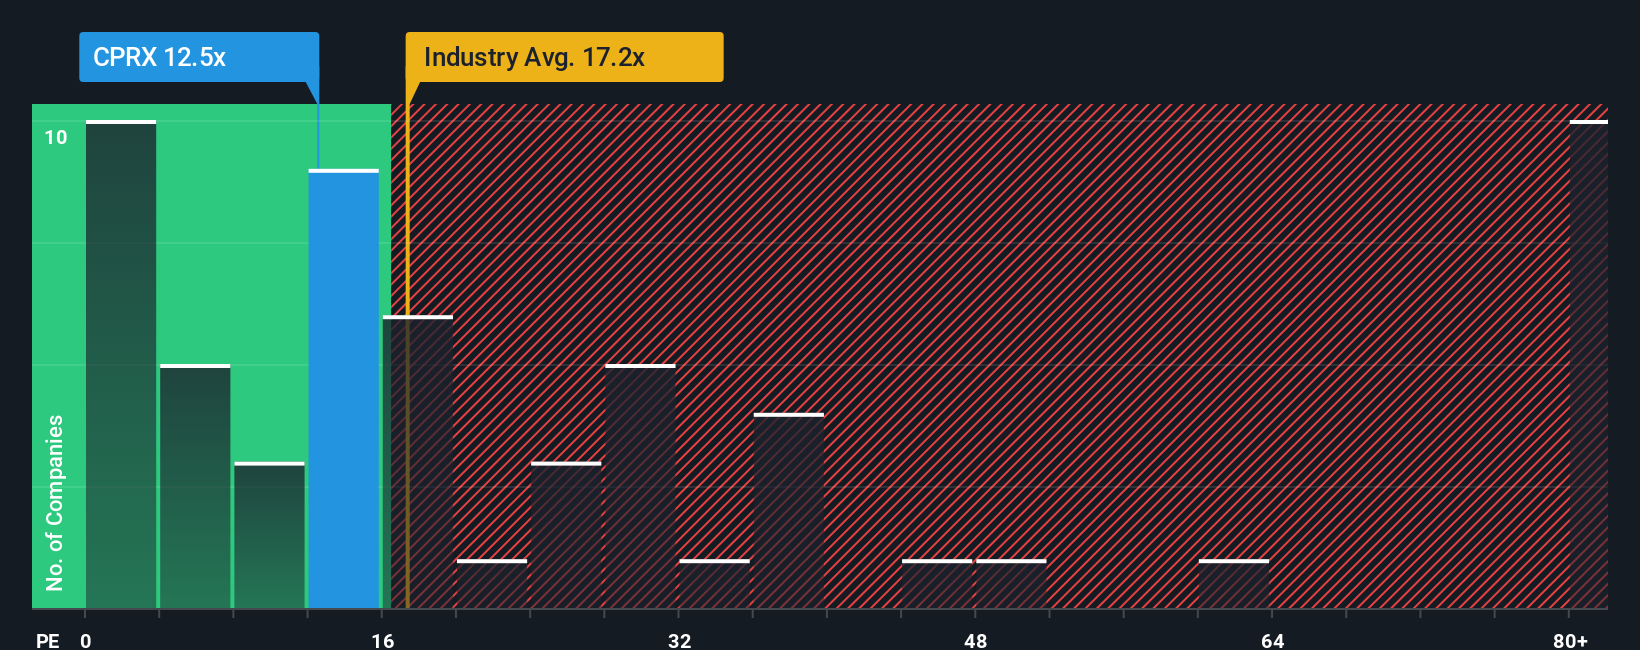
Catalyst currently trades on a PE of about 13.4x. That is well below the broader Biotechs industry average of roughly 20.7x and far under the peer group average of around 73.0x, signaling that the market is applying a clear discount to its earnings compared with many comparable names.
Simply Wall St’s proprietary Fair Ratio framework estimates that, based on Catalyst’s earnings growth outlook, profitability, risk profile, size and industry, a more appropriate PE for the stock would be around 18.0x. This company specific benchmark is more informative than simple peer or industry comparisons because it adjusts for key fundamentals rather than assuming one size fits all. With the shares on 13.4x versus a Fair Ratio of 18.0x, the valuation indicates that the shares are trading below this framework’s assessed level on an earnings basis.
Result: UNDERVALUED
PE ratios tell one story, but what if the real opportunity lies elsewhere? Discover 1463 companies where insiders are betting big on explosive growth.
Upgrade Your Decision Making: Choose your Catalyst Pharmaceuticals Narrative
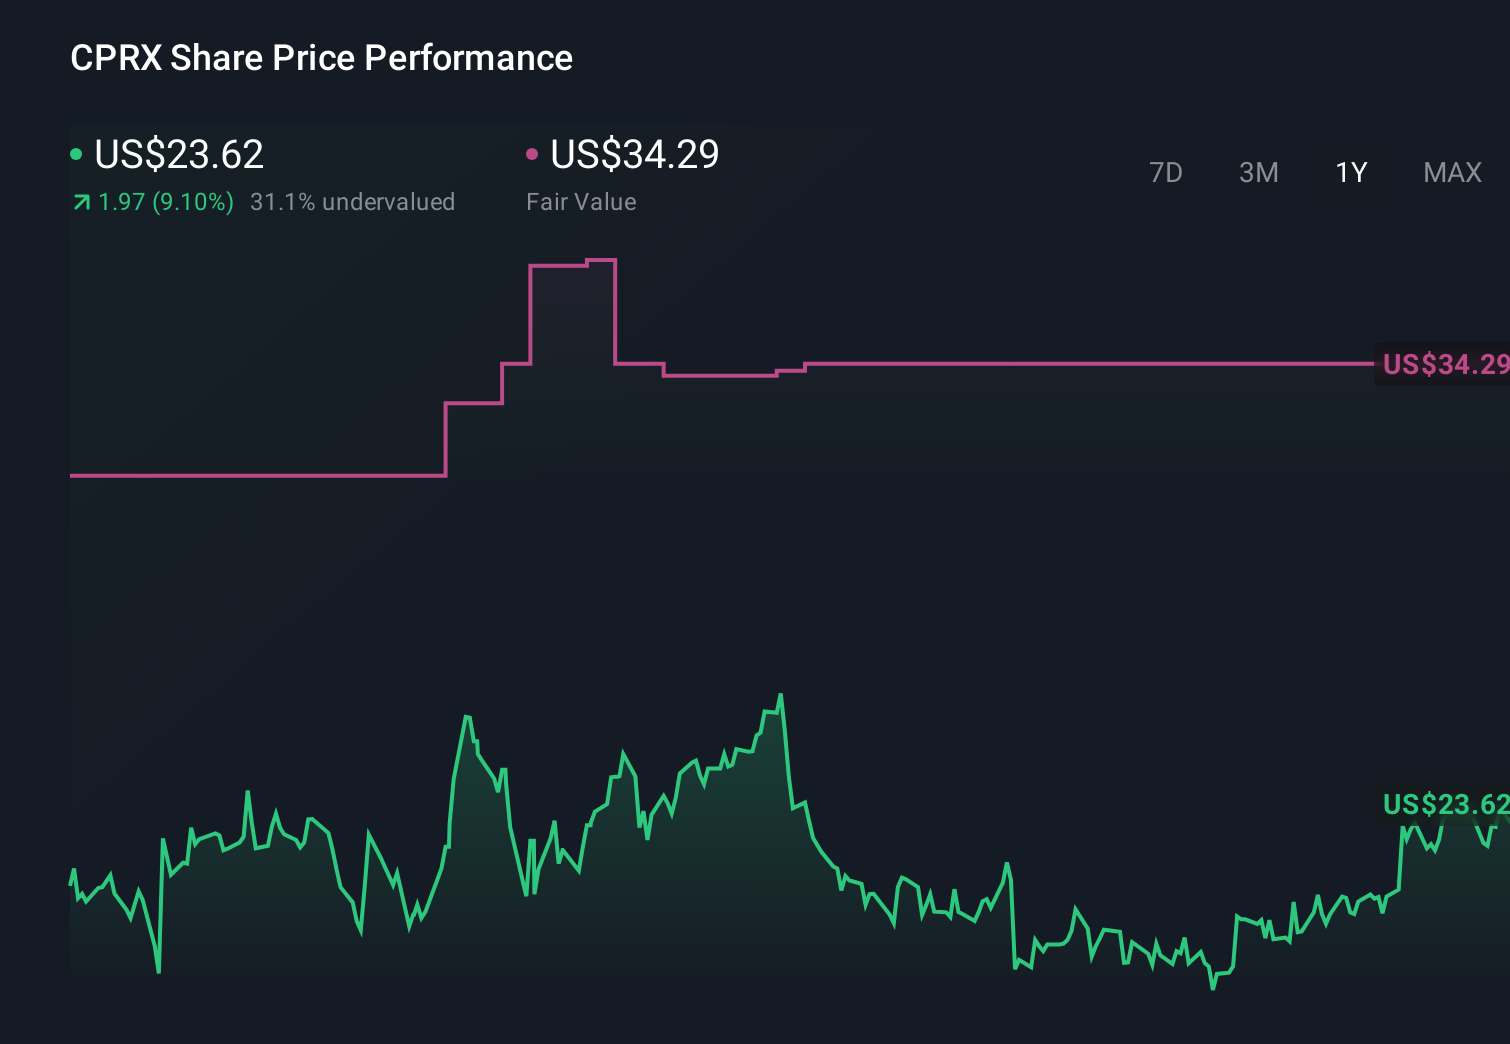
Earlier we mentioned that there is an even better way to understand valuation, so let us introduce you to Narratives, a simple way to connect your view of Catalyst Pharmaceuticals with the numbers behind its fair value. A Narrative is your story about the company, captured as assumptions about future revenue, earnings, and margins, which then link directly to a financial forecast and, ultimately, a fair value estimate. On Simply Wall St, millions of investors build and share these Narratives on the Community page, making the process easy and accessible even if you are not a valuation expert. Once you have a Narrative, you can quickly compare its Fair Value to the current share price to decide whether Catalyst looks like a buy, hold, or sell for you, and your view updates dynamically as new information like earnings or major news is released. For example, one Narrative for Catalyst might see fair value closer to 40 dollars on the back of stronger rare disease growth, while a more cautious Narrative might anchor around 31 dollars due to concerns about pipeline depth and patent risk.
Do you think there's more to the story for Catalyst Pharmaceuticals? Head over to our Community to see what others are saying!
This article by Simply Wall St is general in nature. We provide commentary based on historical data and analyst forecasts only using an unbiased methodology and our articles are not intended to be financial advice. It does not constitute a recommendation to buy or sell any stock, and does not take account of your objectives, or your financial situation. We aim to bring you long-term focused analysis driven by fundamental data. Note that our analysis may not factor in the latest price-sensitive company announcements or qualitative material. Simply Wall St has no position in any stocks mentioned.
Have feedback on this article? Concerned about the content? Get in touch with us directly. Alternatively, email editorial-team@simplywallst.com