
 Nasdaq
 华尔街日报
华尔街日报Does Freeport-McMoRan’s 2025 Rally Match Its Long Term Cash Flow Potential?
- Wondering if Freeport-McMoRan is still a smart way to play copper and gold, or if the recent run means you missed it? You are not alone, and that is exactly what we are going to unpack here.
- The stock has climbed 3.7% over the last week, 23.3% in the last month, and is now up 29.8% year to date and 111.8% over five years, which indicates the market is steadily repricing its long term prospects.
- Those moves have come as investors focus on tightening copper supply, rising long term demand from electrification, and ongoing geopolitical tensions that keep a bid under key commodities. At the same time, shifting expectations around interest rates and inflation are changing how markets value cyclical resource names like Freeport-McMoRan.
- Right now, the company scores just 2/6 on our valuation checks, suggesting pockets of undervaluation but also areas where the price looks full. We will walk through different valuation approaches next and then finish with a more intuitive way to think about what the stock is really worth.
Freeport-McMoRan scores just 2/6 on our valuation checks. See what other red flags we found in the full valuation breakdown.
Approach 1: Freeport-McMoRan Discounted Cash Flow (DCF) Analysis
A Discounted Cash Flow model estimates what a business is worth today by projecting its future cash flows and then discounting those back to their present value. For Freeport-McMoRan, the model uses a 2 stage Free Cash Flow to Equity approach.
The company generated roughly $1.4 Billion in free cash flow over the last twelve months, and analysts expect this to climb sharply as new projects ramp up and copper prices remain supportive. By 2029, free cash flow is projected to reach about $9.0 Billion, with further growth extrapolated beyond analyst coverage out to 2035, all expressed in dollar terms. Each of these future cash flows is discounted to reflect risk and the time value of money.
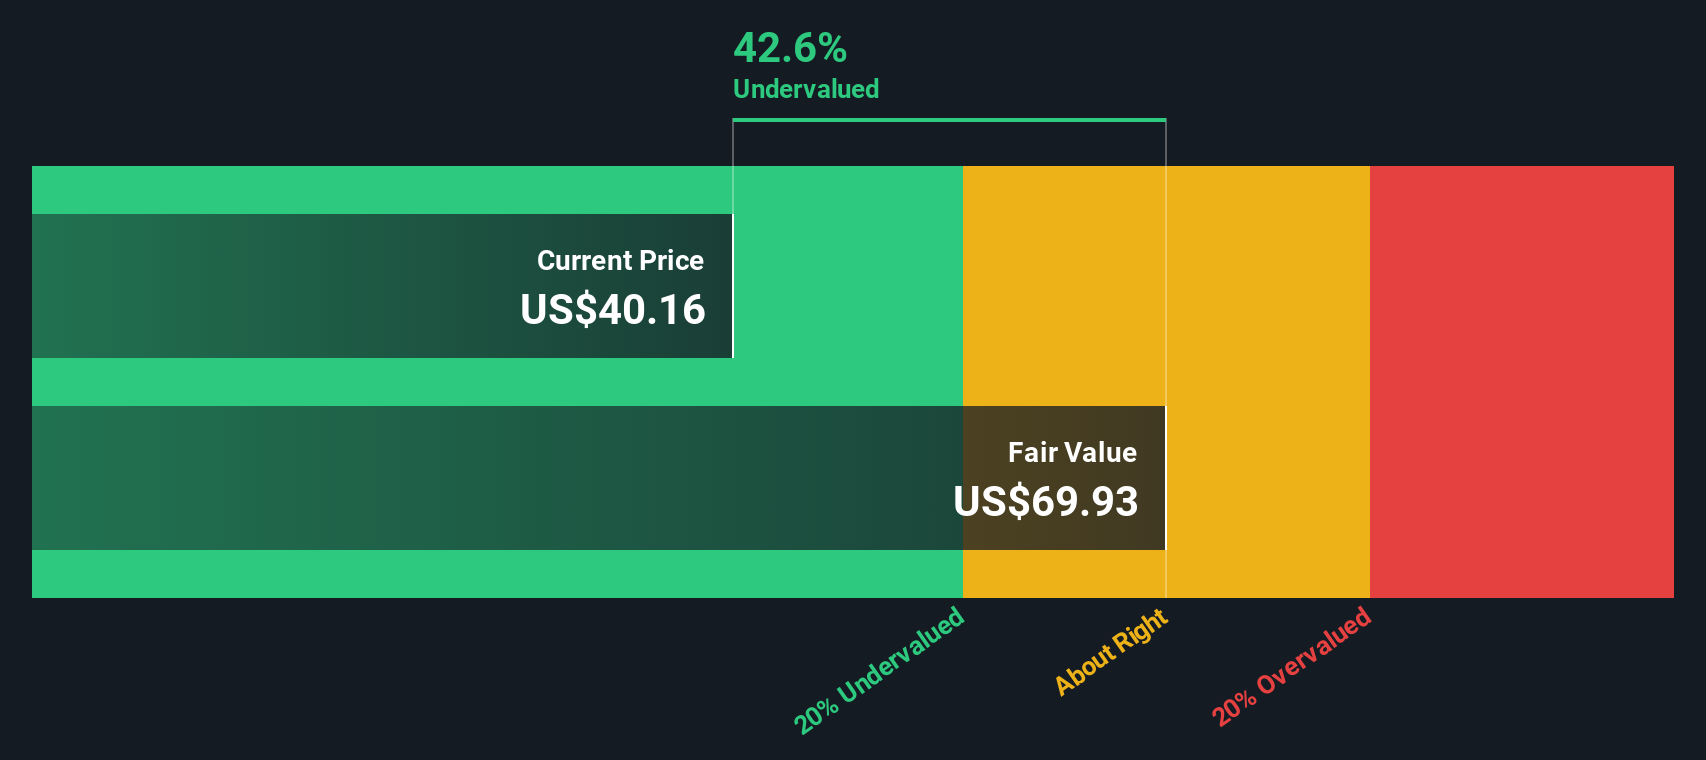
On this basis, the intrinsic value is estimated at about $110.43 per share, which implies the stock is trading at roughly a 55.5% discount to its DCF fair value. In other words, if these cash flow projections prove broadly accurate, Freeport-McMoRan appears materially undervalued on a long term cash flow basis.
Result: UNDERVALUED
Our Discounted Cash Flow (DCF) analysis suggests Freeport-McMoRan is undervalued by 55.5%. Track this in your watchlist or portfolio, or discover 914 more undervalued stocks based on cash flows.
Approach 2: Freeport-McMoRan Price vs Earnings
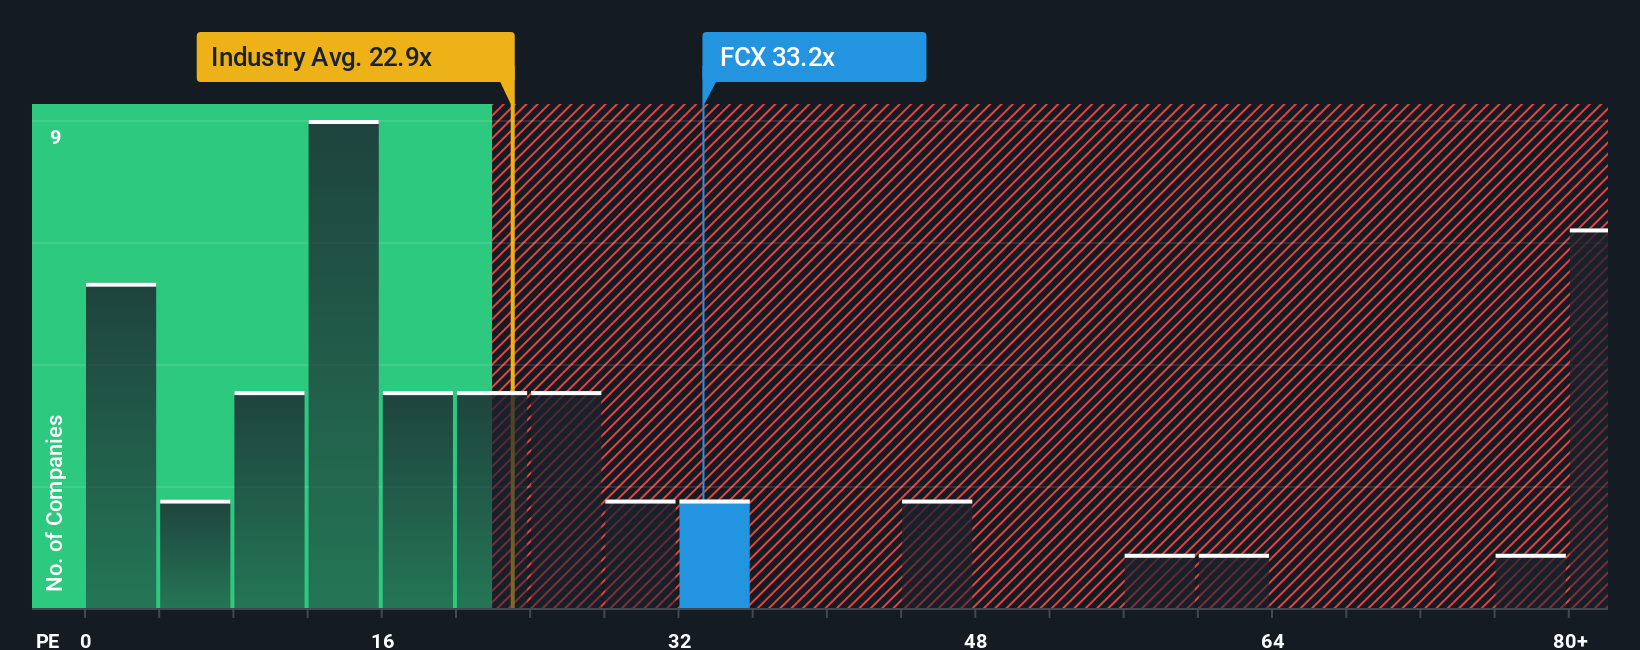
For a profitable, cyclical miner like Freeport-McMoRan, the price to earnings ratio is a useful way to gauge how much the market is willing to pay today for each dollar of current earnings. In general, stronger and more durable growth, plus lower perceived risk, justifies a higher normal PE, while volatile earnings or elevated geopolitical and commodity risks usually warrant a discount.
Freeport-McMoRan currently trades on a PE of about 34.2x, above both the Metals and Mining industry average of roughly 25.4x and the broader peer group at around 22.7x. Simply Wall St’s Fair Ratio for the stock is 28.1x, which is the PE you might expect given its specific mix of earnings growth potential, industry dynamics, margins, size and risk profile.
This Fair Ratio is more tailored than a simple peer or industry comparison, because it explicitly adjusts for Freeport-McMoRan’s own growth outlook, profitability and risk, rather than assuming all miners deserve the same multiple. With the market applying a 34.2x PE versus a Fair Ratio of 28.1x, the shares look somewhat expensive on this earnings based lens.
Result: OVERVALUED
PE ratios tell one story, but what if the real opportunity lies elsewhere? Discover 1463 companies where insiders are betting big on explosive growth.
Upgrade Your Decision Making: Choose your Freeport-McMoRan Narrative
Earlier we mentioned that there is an even better way to understand valuation, so let us introduce you to Narratives, which are simple, investor created stories that connect what you believe about a company’s future to concrete numbers like revenue, earnings, margins and ultimately fair value.
On Simply Wall St’s Community page, millions of investors use Narratives as an easy, accessible tool to spell out their view of a business, link that story to a financial forecast, and then compare the resulting Fair Value to today’s Price to help them decide whether it looks like a buy, hold or sell.
Because Narratives on the platform are updated dynamically when new information such as earnings reports, commodity price moves or major news becomes available, they can help you continuously test whether your original story for a stock like Freeport-McMoRan still holds up or needs to change.
For example, one Freeport-McMoRan Narrative might assume stronger copper demand, higher long term margins around 12 percent and a fair value near $57. A more cautious Narrative could focus on Grasberg and policy risks, use lower growth and a higher discount rate, and land closer to $27. This shows how two reasonable stories can justify very different price targets.
Do you think there's more to the story for Freeport-McMoRan? Head over to our Community to see what others are saying!

This article by Simply Wall St is general in nature. We provide commentary based on historical data and analyst forecasts only using an unbiased methodology and our articles are not intended to be financial advice. It does not constitute a recommendation to buy or sell any stock, and does not take account of your objectives, or your financial situation. We aim to bring you long-term focused analysis driven by fundamental data. Note that our analysis may not factor in the latest price-sensitive company announcements or qualitative material. Simply Wall St has no position in any stocks mentioned.
Have feedback on this article? Concerned about the content? Get in touch with us directly. Alternatively, email editorial-team@simplywallst.com