
 Nasdaq
 华尔街日报
华尔街日报Is It Too Late To Consider Commercial Metals After Its 273% Five Year Surge?
- If you have ever wondered whether Commercial Metals is still a smart buy after its big run, you are not alone. This stock has quietly become one of the more interesting value stories in the steel and metals space.
- Despite a small pullback of about 1.5% over the last week, the share price is up 17.1% in the past month, 41.4% year to date, and an impressive 273.2% over five years, which naturally raises the question of whether the current price fully reflects its fundamentals.
- Recent attention on infrastructure spending, reshoring of US manufacturing, and tighter supply conditions in steel and rebar markets has put Commercial Metals back on many investors' radar. Regulatory support for domestic production and ongoing construction demand have also helped frame the stock as a potential long term structural winner, rather than just a cyclical trade.
- Yet on our numbers, Commercial Metals currently scores 0/6 on our valuation checks, as shown in its valuation score. In the sections that follow we will unpack why that is across multiple valuation methods and finish by exploring a more nuanced way to think about what the market is really pricing in. Curious how numbers become stories that shape markets? Explore Community Narratives
Commercial Metals scores just 0/6 on our valuation checks. See what other red flags we found in the full valuation breakdown.
Approach 1: Commercial Metals Discounted Cash Flow (DCF) Analysis
A Discounted Cash Flow model estimates what a company is worth today by projecting its future cash flows and then discounting those back to a present value using a required rate of return.
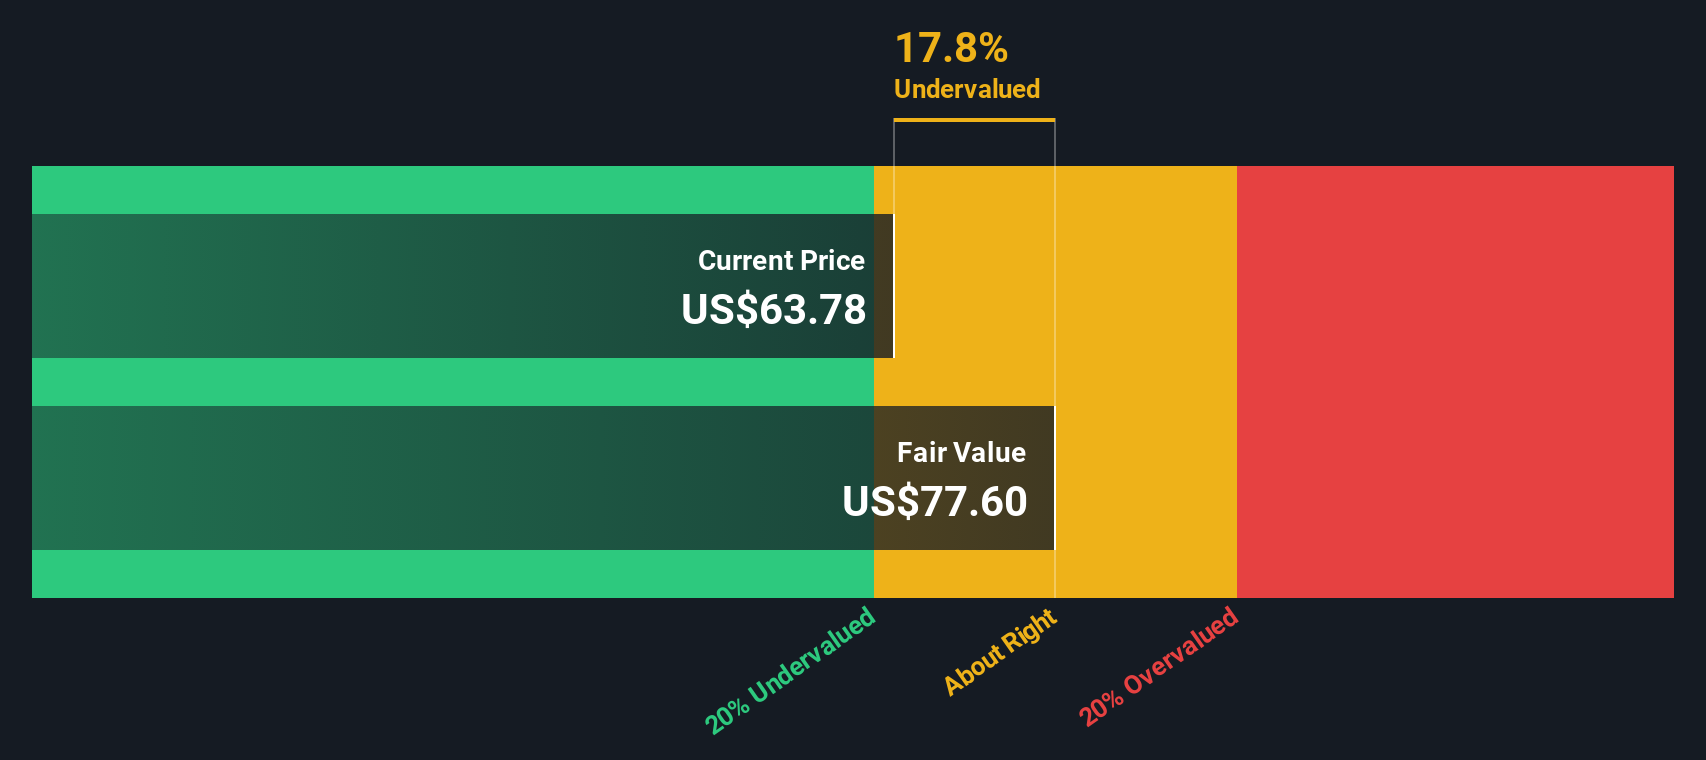
For Commercial Metals, the 2 Stage Free Cash Flow to Equity model starts with last twelve months Free Cash Flow of about $291 million, then applies analyst forecasts and longer term extrapolations. Analyst estimates point to Free Cash Flow rising to around $540 million by 2028, with further projected cash flows steadily trending in the $480 million to just over $500 million range by 2035, based on Simply Wall St extrapolations.
Aggregating and discounting these projected cash flows results in an estimated intrinsic value of about $67.02 per share. Compared with the current share price, the DCF suggests the stock is roughly 3.7% overvalued, which is a relatively small gap and within a reasonable margin of error for this kind of model.
Result: ABOUT RIGHT
Commercial Metals is fairly valued according to our Discounted Cash Flow (DCF), but this can change at a moment's notice. Track the value in your watchlist or portfolio and be alerted on when to act.
Approach 2: Commercial Metals Price vs Earnings
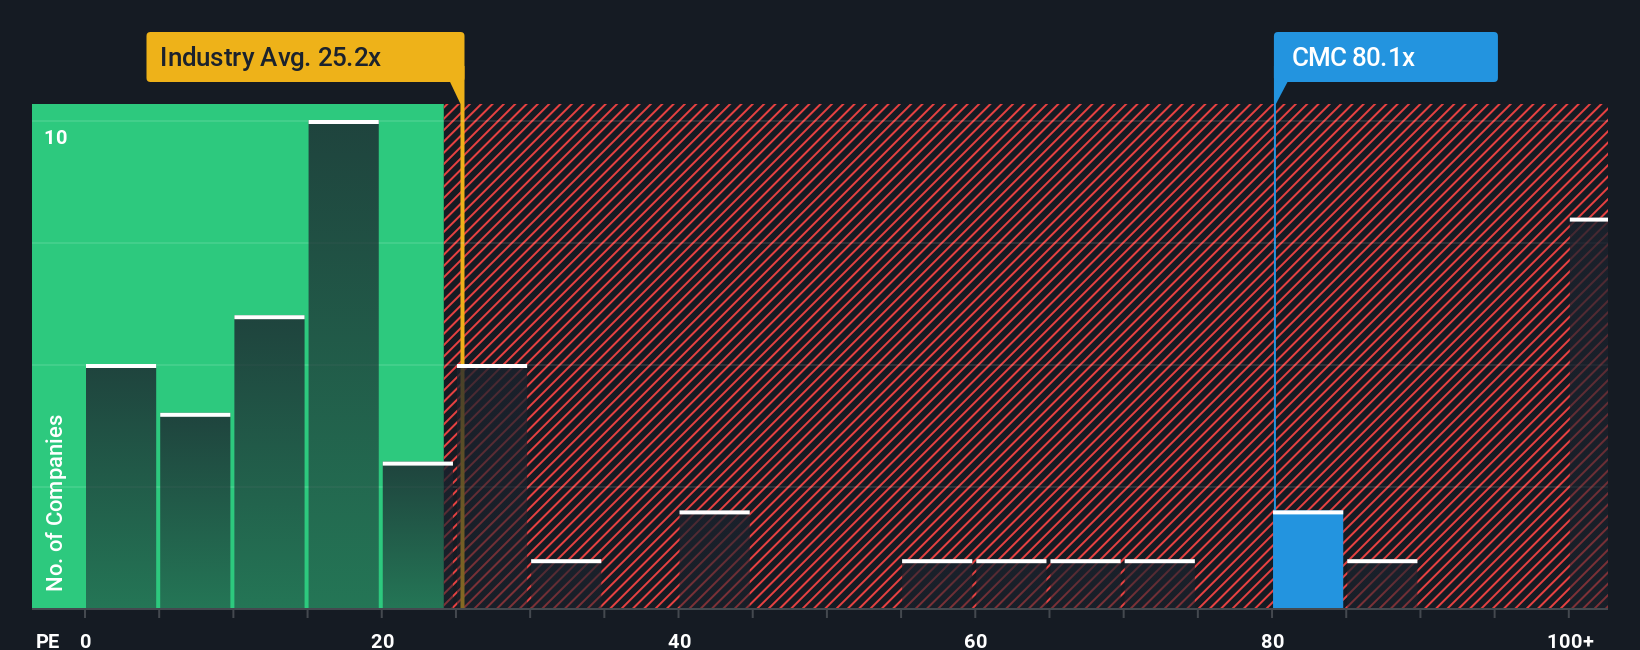
For a consistently profitable company like Commercial Metals, the price to earnings, or PE, ratio is a useful way to see how much investors are paying for each dollar of current earnings. In general, businesses with stronger growth prospects and lower perceived risk can justify a higher PE, while slower growing or riskier companies tend to trade on lower multiples.
Commercial Metals currently trades on a PE of about 91.1x, which is well above both the Metals and Mining industry average of around 25.4x and a peer average of roughly 47.8x. To get a more tailored view, Simply Wall St uses a proprietary Fair Ratio metric, which estimates what PE you might expect for this specific business given its earnings growth outlook, industry context, profit margins, market cap and risk profile. Because it is customised to Commercial Metals, the Fair Ratio of about 28.6x is more informative than a simple comparison with broad industry or peer averages.
Putting this together, the current PE of 91.1x sits far above the Fair Ratio of 28.6x, which points to a valuation that appears stretched on earnings.
Result: OVERVALUED
PE ratios tell one story, but what if the real opportunity lies elsewhere? Discover 1464 companies where insiders are betting big on explosive growth.
Upgrade Your Decision Making: Choose your Commercial Metals Narrative
Earlier we mentioned that there is an even better way to understand valuation, so let us introduce you to Narratives, a simple framework on Simply Wall St’s Community page that lets you attach your own story about Commercial Metals to the numbers by linking your view of its future revenue, earnings and margins to a forecast and then to a fair value you can compare with today’s price.
With Narratives, you quickly see whether your fair value says “buy” or “sell” versus the current market price, and because they refresh automatically when new earnings, news or guidance arrives, your view of Commercial Metals stays up to date without you having to rebuild a model from scratch.
For example, one Commercial Metals Narrative on the platform assumes strong execution on expansion projects and margin improvements and lands at a fair value near $67.85, while a more cautious Narrative that focuses on legal risks, competitive rebar capacity and margin pressure comes in closer to $47, showing how different, well reasoned stories can translate into very different yet transparent valuation views for the same stock.
Do you think there's more to the story for Commercial Metals? Head over to our Community to see what others are saying!

This article by Simply Wall St is general in nature. We provide commentary based on historical data and analyst forecasts only using an unbiased methodology and our articles are not intended to be financial advice. It does not constitute a recommendation to buy or sell any stock, and does not take account of your objectives, or your financial situation. We aim to bring you long-term focused analysis driven by fundamental data. Note that our analysis may not factor in the latest price-sensitive company announcements or qualitative material. Simply Wall St has no position in any stocks mentioned.
Have feedback on this article? Concerned about the content? Get in touch with us directly. Alternatively, email editorial-team@simplywallst.com