
 Nasdaq
 华尔街日报
华尔街日报Is It Too Late To Consider Penumbra After Its Strong 2025 Rally?
- If you are wondering whether Penumbra is still worth buying after its big run up, or if the smart move now is to wait on the sidelines, you are in the right place.
- The stock has climbed 1.2% over the last week, 9.5% over the past month, and 31.6% year to date, adding up to a 30.2% gain over 1 year and 68.6% over 5 years.
- Those gains have been driven by ongoing optimism around its medical devices pipeline and growing adoption of its minimally invasive technologies in stroke and vascular treatment. Investors are effectively paying up today for a story that hinges on continued innovation and market share gains, which makes the valuation question even more critical.
- Despite that enthusiasm, Penumbra currently scores just 0/6 on our valuation checks, so in the next sections we will unpack what different valuation methods say about the stock, then finish with a more nuanced way to think about what it is really worth.
Penumbra scores just 0/6 on our valuation checks. See what other red flags we found in the full valuation breakdown.
Approach 1: Penumbra Discounted Cash Flow (DCF) Analysis
The Discounted Cash Flow model estimates what a business is worth today by projecting its future cash flows and then discounting those back to their present value. For Penumbra, this 2 Stage Free Cash Flow to Equity model starts with its last twelve months Free Cash Flow of about $170 million and extends analyst forecasts a few years out, then extrapolates further using modest growth assumptions.
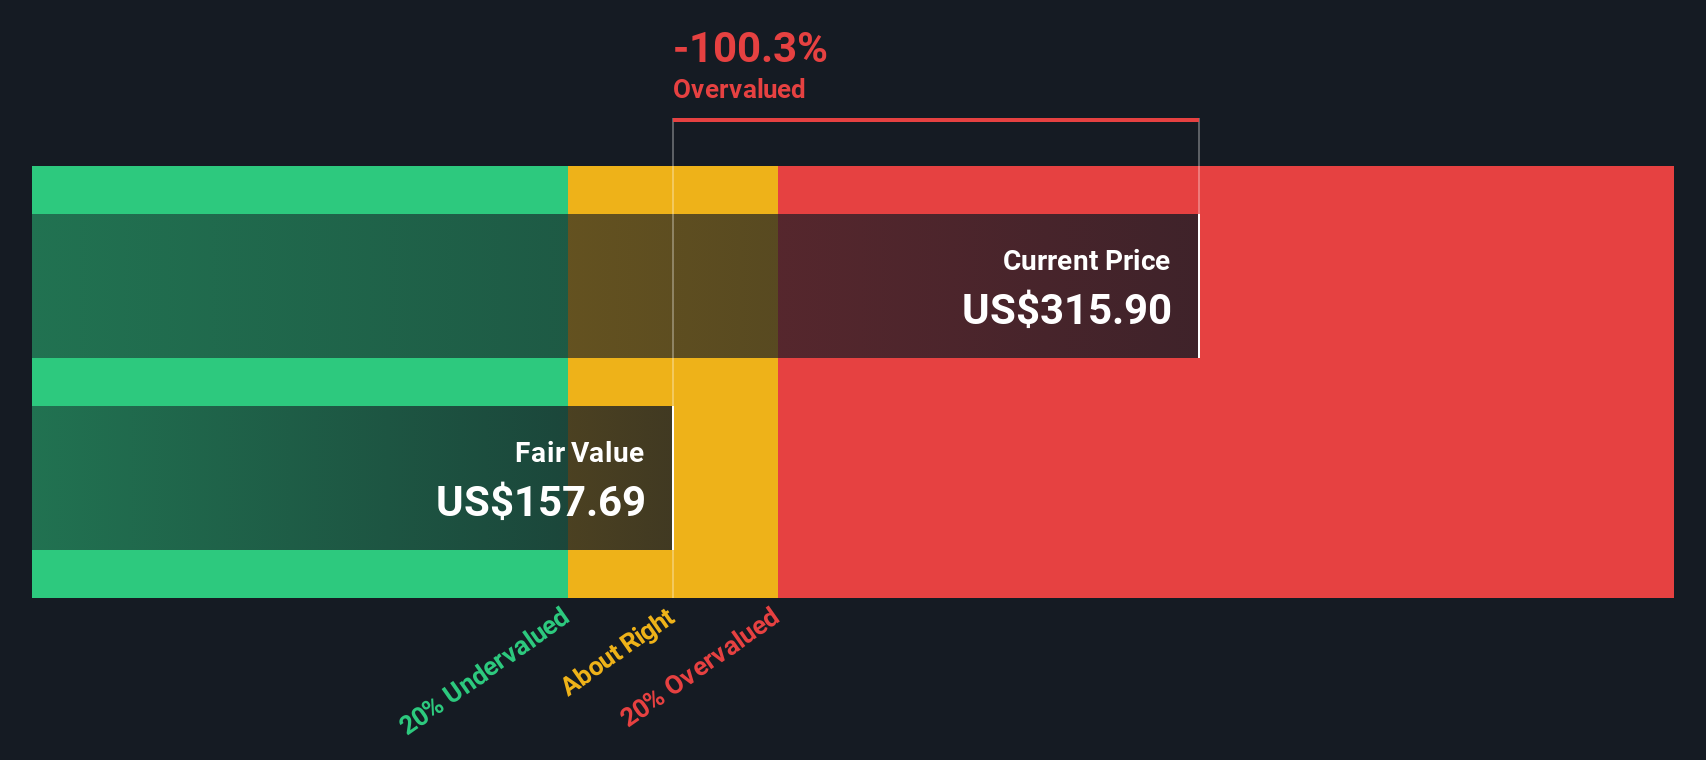
On this basis, Penumbra’s Free Cash Flow is projected to rise to roughly $368 million by 2035, with annual values gradually stepping up over the next decade as its devices gain traction. All of these future cash flows are converted to today’s dollars using a required return, producing an estimated intrinsic value of about $157.69 per share.
Compared with the current market price, the DCF implies the stock is about 100.3% overvalued, indicating that investors are paying well ahead of the modeled cash flow story.
Result: OVERVALUED
Our Discounted Cash Flow (DCF) analysis suggests Penumbra may be overvalued by 100.3%. Discover 912 undervalued stocks or create your own screener to find better value opportunities.
Approach 2: Penumbra Price vs Earnings
For a profitable company like Penumbra, the price to earnings, or PE, ratio is a useful way to judge whether investors are paying a reasonable price for each dollar of current earnings. In simple terms, faster growth and lower risk usually justify a higher PE, while slower growth or higher uncertainty should translate into a lower, more conservative multiple.
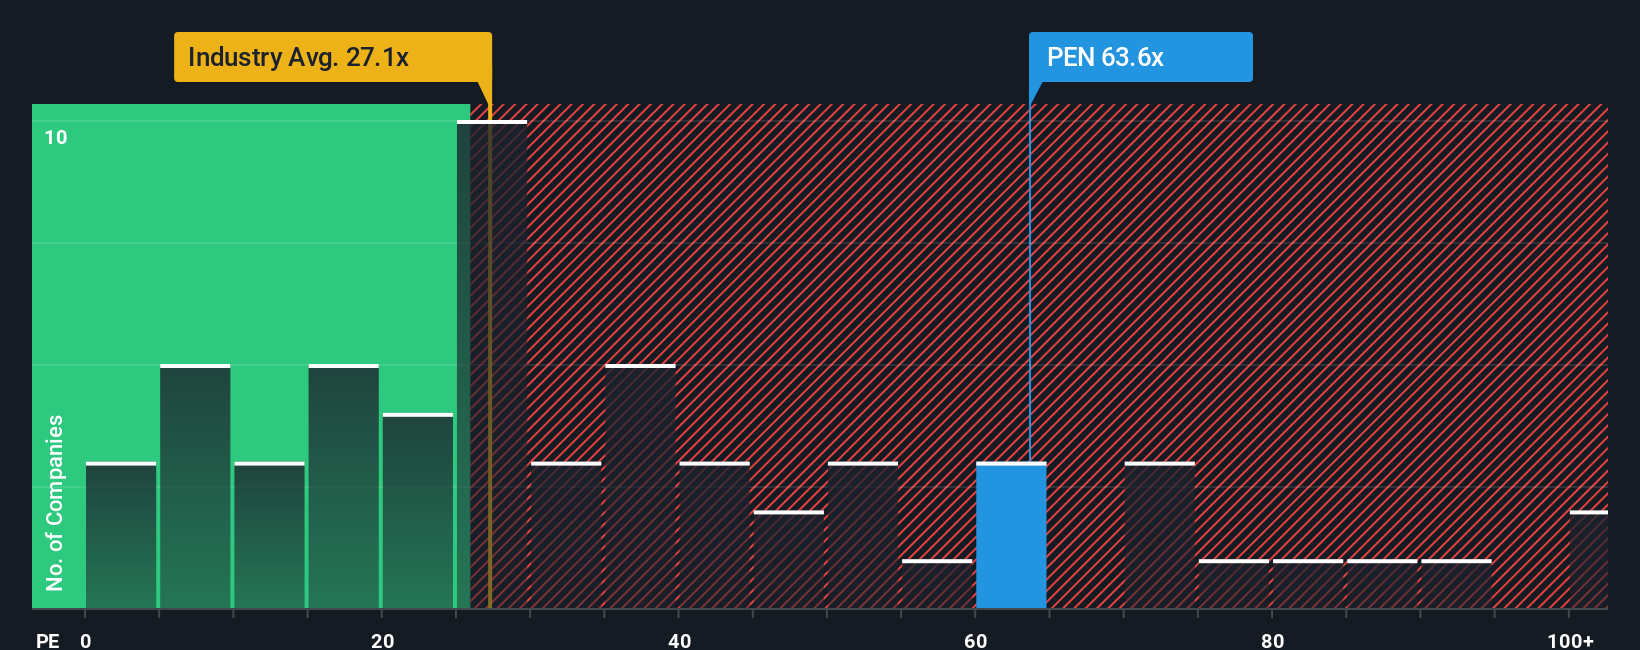
Penumbra currently trades on a PE of about 75.4x, which is far richer than both the Medical Equipment industry average of roughly 29.7x and the broader peer group average of about 40.4x. To go beyond these simple comparisons, Simply Wall St uses a proprietary Fair Ratio, which estimates what PE the company deserves based on its earnings growth outlook, profit margins, risk profile, size and industry context. For Penumbra, this Fair Ratio is calculated at around 29.5x.
Because the Fair Ratio blends growth, risk, profitability, industry dynamics and market cap into a single benchmark, it offers a more tailored yardstick than blunt peer or sector averages. Comparing Penumbra’s current 75.4x to the 29.5x Fair Ratio suggests the market is paying a substantial premium to its fundamentals.
Result: OVERVALUED
PE ratios tell one story, but what if the real opportunity lies elsewhere? Discover 1463 companies where insiders are betting big on explosive growth.
Upgrade Your Decision Making: Choose your Penumbra Narrative
Earlier we mentioned that there is an even better way to understand valuation, so let us introduce you to Narratives, a simple framework on Simply Wall St’s Community page where you attach your story about Penumbra to the numbers by choosing assumptions for future revenue, earnings and margins. These then flow through to a forecast and a Fair Value you can compare to today’s price to help you decide whether to buy, hold or sell. The platform continuously refreshes your Narrative as new data, news or earnings arrive. For example, a more optimistic Penumbra investor might lean into the STORM-PE trial success, stronger 2025 guidance and premium margins to justify a higher growth path and a Fair Value closer to the upper analyst target near $350. A more cautious investor could instead focus on competition, regulatory risk and margin pressure to anchor on slower growth and a Fair Value nearer the low end around $186, both using the same tool but different stories to drive clearer, more dynamic decisions.
Do you think there's more to the story for Penumbra? Head over to our Community to see what others are saying!

This article by Simply Wall St is general in nature. We provide commentary based on historical data and analyst forecasts only using an unbiased methodology and our articles are not intended to be financial advice. It does not constitute a recommendation to buy or sell any stock, and does not take account of your objectives, or your financial situation. We aim to bring you long-term focused analysis driven by fundamental data. Note that our analysis may not factor in the latest price-sensitive company announcements or qualitative material. Simply Wall St has no position in any stocks mentioned.
Have feedback on this article? Concerned about the content? Get in touch with us directly. Alternatively, email editorial-team@simplywallst.com