
 Nasdaq
 华尔街日报
华尔街日报Does the New York Times Rally Still Make Sense After 35% Gain in 2025?
- Wondering if New York Times stock is still worth buying after its big run, or if the easy money has already been made? Let us break down what the market is really pricing in here.
- The shares have climbed 4.1% over the last week, 10.4% over the past month, and are up a striking 35.3% year to date, adding to a 35.6% gain over the last year and 121.6% over three years.
- Some of that momentum has been fueled by ongoing enthusiasm around its growing digital subscription base and the strength of its well known brand in a noisy media landscape. Investors are also watching how management leans into new products and bundles, which is shaping expectations for the company as more of a digital platform rather than an old school newspaper.
- Despite those gains, New York Times only scores 1/6 on our valuation checks. This suggests the stock screens as undervalued on just one metric. We will walk through what each approach says and then finish with a more holistic way to think about valuation that goes beyond any single model.
New York Times scores just 1/6 on our valuation checks. See what other red flags we found in the full valuation breakdown.
Approach 1: New York Times Discounted Cash Flow (DCF) Analysis
A Discounted Cash Flow model estimates what a business is worth by projecting the cash it can generate in the future and then discounting those cash flows back to today in $ terms.
For New York Times, the latest twelve months Free Cash Flow is about $540 million. Analysts provide explicit forecasts for the next few years. Beyond that point, Simply Wall St extrapolates a gradual growth path. Under this two stage Free Cash Flow to Equity approach, Free Cash Flow is projected to rise to around $667 million by 2035, reflecting modest but steady expansion of the digital platform over time.
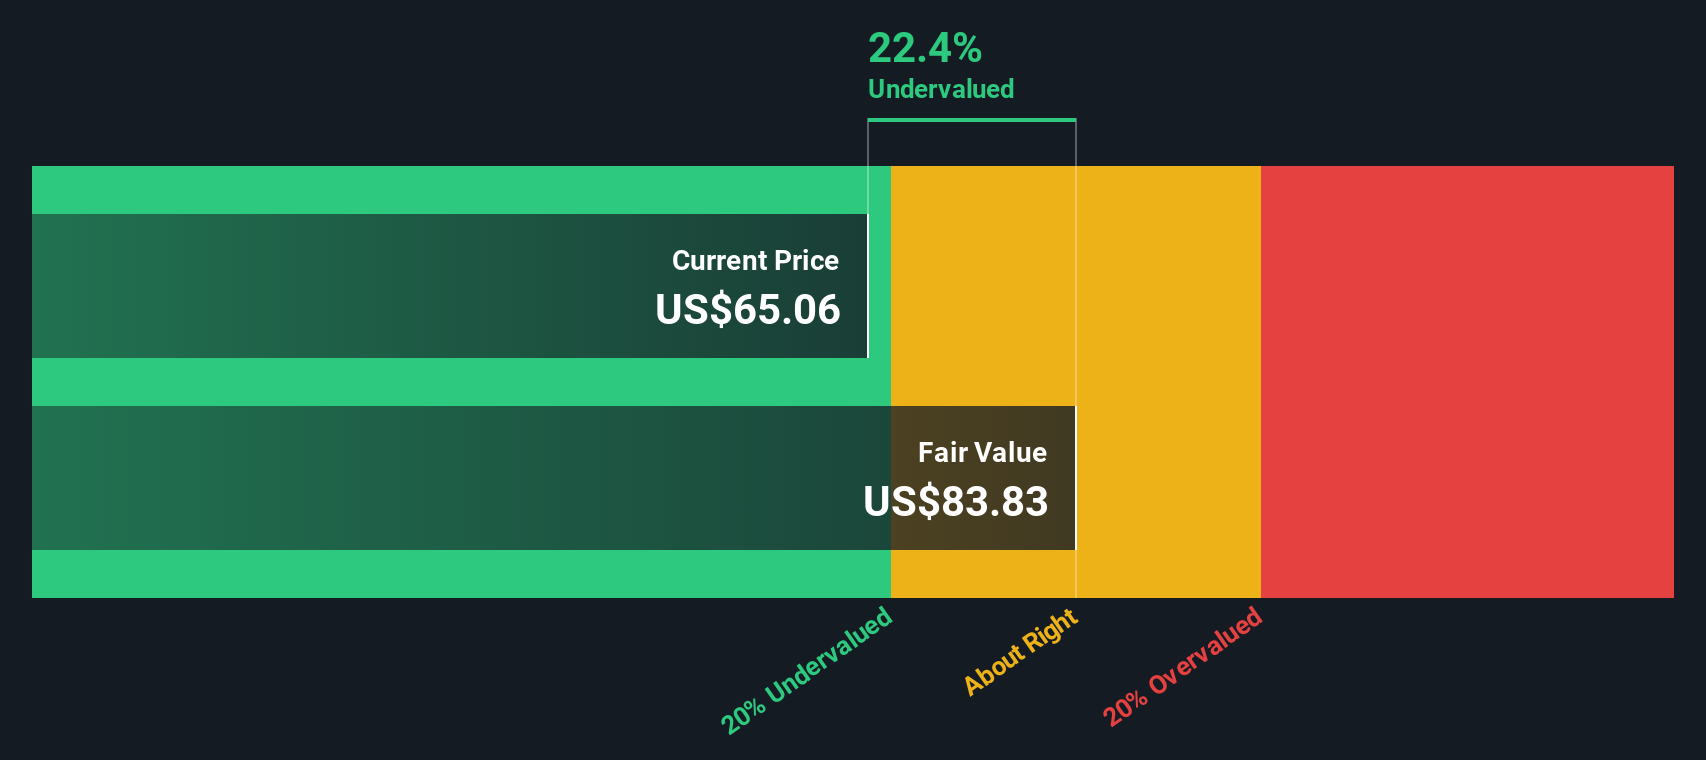
When all those projected cash flows are discounted back to today, the model points to an intrinsic value of about $83.83 per share. Compared with the current share price, this implies the stock is trading at roughly a 15.6% discount, suggesting that the market is not fully pricing in the company’s future cash generation.
Result: UNDERVALUED
Our Discounted Cash Flow (DCF) analysis suggests New York Times is undervalued by 15.6%. Track this in your watchlist or portfolio, or discover 912 more undervalued stocks based on cash flows.
Approach 2: New York Times Price vs Earnings
For profitable businesses like New York Times, the Price to Earnings ratio is often the go to valuation yardstick because it links what investors pay today to the profits the company is already generating. In general, faster growth and lower risk justify a higher PE ratio, while slower growth or more uncertainty tend to pull a fair multiple lower.
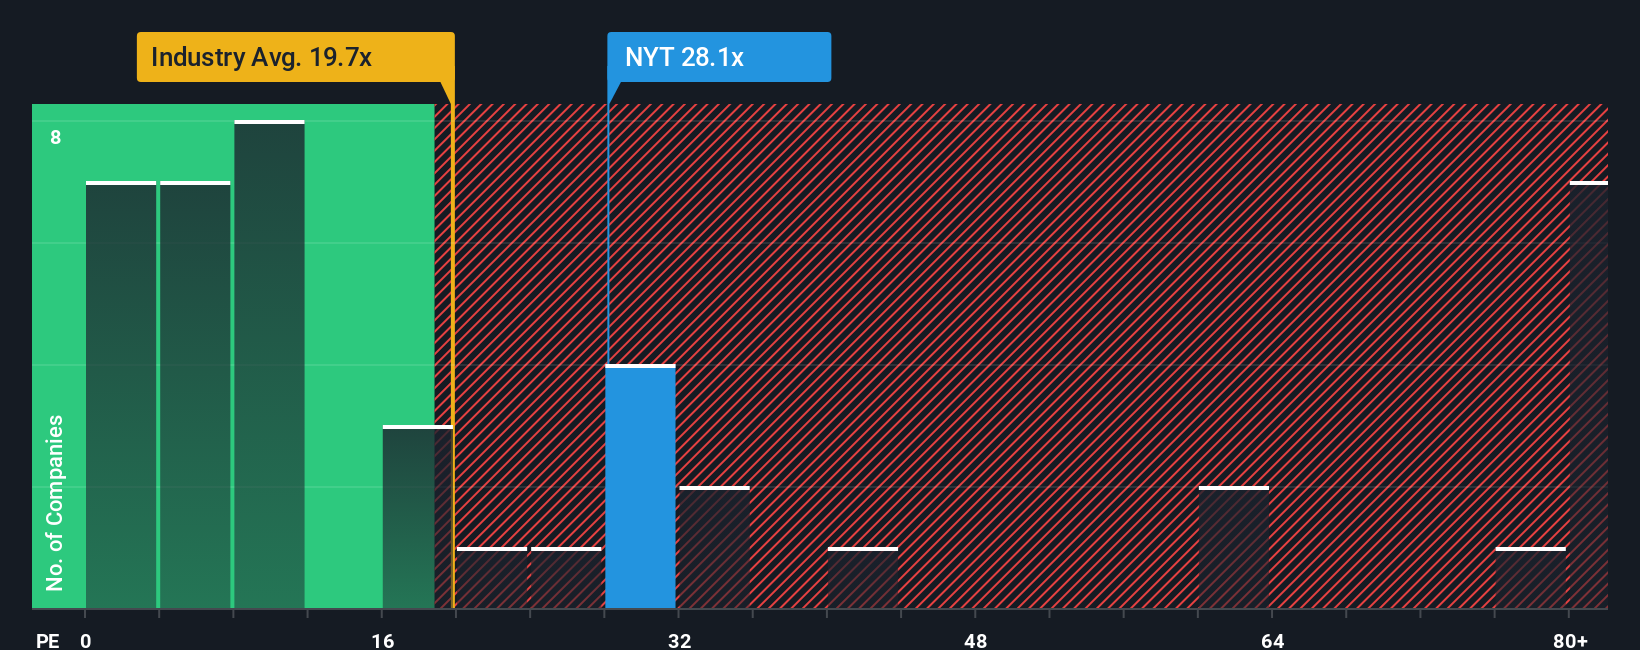
New York Times currently trades on a PE of about 34.0x, which is well above the broader Media industry average of around 16.0x and also richer than the peer group average of roughly 28.6x. On the surface, that premium suggests investors are willing to pay up for its brand strength, digital scale and balance sheet.
Simply Wall St’s Fair Ratio framework goes a step further by estimating the PE multiple that would make sense for New York Times given its earnings growth outlook, profitability, risk profile, industry and market cap. That analysis points to a Fair Ratio of about 20.4x, noticeably lower than where the shares trade today. Because this approach adjusts for the company’s specific strengths and risks rather than relying on broad peer comparisons, it offers a more tailored view of value and indicates the stock screens as expensive on earnings.
Result: OVERVALUED
PE ratios tell one story, but what if the real opportunity lies elsewhere? Discover 1463 companies where insiders are betting big on explosive growth.
Upgrade Your Decision Making: Choose your New York Times Narrative
Earlier we mentioned that there is an even better way to understand valuation. Let us introduce you to Narratives, an easy tool on Simply Wall St’s Community page that lets you connect your view of New York Times’s story to specific forecasts for revenue, earnings and margins. It then translates those inputs into a Fair Value and compares that Fair Value to today’s price to help you think about whether to buy, hold or sell. The platform automatically updates your Narrative as new earnings, news and analyst targets come in. You can then see, for example, how one investor might build a bullish Narrative around a Fair Value near the top end of recent targets, such as about 70 per share based on strong digital growth and resilient margins. Another investor might take a more cautious stance with a Fair Value closer to 52 per share if they think competition, traffic shifts and margin pressure will be more significant. This provides a single, dynamic view of how reasonable people can look at the same company and reach very different, clearly quantified conclusions.
Do you think there's more to the story for New York Times? Head over to our Community to see what others are saying!

This article by Simply Wall St is general in nature. We provide commentary based on historical data and analyst forecasts only using an unbiased methodology and our articles are not intended to be financial advice. It does not constitute a recommendation to buy or sell any stock, and does not take account of your objectives, or your financial situation. We aim to bring you long-term focused analysis driven by fundamental data. Note that our analysis may not factor in the latest price-sensitive company announcements or qualitative material. Simply Wall St has no position in any stocks mentioned.
Have feedback on this article? Concerned about the content? Get in touch with us directly. Alternatively, email editorial-team@simplywallst.com