
 Nasdaq
 华尔街日报
华尔街日报Shanghai Henlius Biotech (SEHK:2696) Valuation Check After US FDA IND Approval for HLX18 Biosimilar Trial
Shanghai Henlius Biotech (SEHK:2696) just cleared a key hurdle by securing US FDA approval of its IND for HLX18, a nivolumab biosimilar, which paves the way for phase 1 trials in multiple solid tumors.
See our latest analysis for Shanghai Henlius Biotech.
That HLX18 milestone lands after a busy year for Henlius, with HLX22 plus HLX87 also moving deeper into breast cancer trials. It comes despite a 90 day share price return of minus 19.39 percent and a still eye catching three year total shareholder return of 381.15 percent, suggesting long term momentum remains strong even as near term sentiment cools.
If Henlius FDA progress has piqued your interest in healthcare names with pipeline upside, this could be a good moment to explore other healthcare stocks that the market may be overlooking.
With the share price still trading at a steep discount to analyst targets despite strong multi year returns, is Henlius a mispriced growth story in biotech, or are markets already correctly factoring in its next leg of expansion?
Price-to-Earnings of 37.3x: Is it justified?
On a trailing price-to-earnings ratio of 37.3 times, Shanghai Henlius Biotech screens rich versus its own estimated fair multiple but roughly in line with regional biotech peers.
The price-to-earnings multiple compares the current share price with the company’s per share earnings, so a higher ratio generally reflects stronger profit expectations or a quality premium. For a profitable, higher growth biotech name, investors often accept a richer multiple in anticipation of sustained earnings expansion.
In Henlius case, the market is paying 37.3 times earnings compared with an estimated fair price-to-earnings ratio of 20.9 times, which implies investors are currently assigning a substantial premium to near term profits. Yet against the Asian biotech industry average of 38.5 times, Henlius trades at only a slight discount. This suggests sector wide optimism could gradually converge towards that lower fair ratio level if growth cools.
Explore the SWS fair ratio for Shanghai Henlius Biotech
Result: Price-to-Earnings of 37.3x (OVERVALUED)
However, regulatory delays, clinical setbacks, or weaker than expected uptake for newly launched biosimilars could quickly challenge both valuation premiums and long term growth assumptions.
Find out about the key risks to this Shanghai Henlius Biotech narrative.
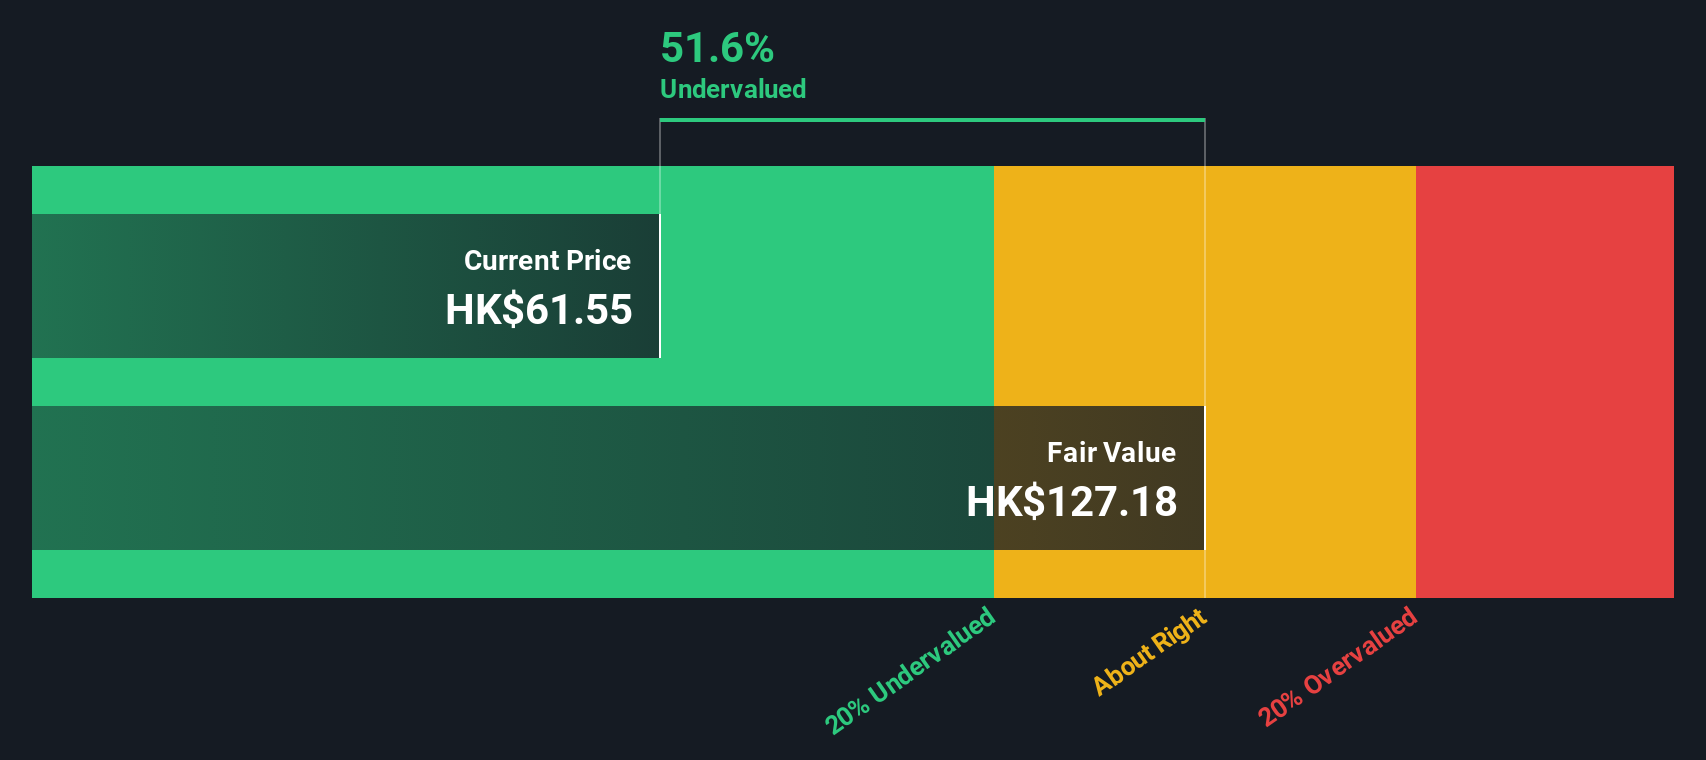
Another View: Our DCF Says the Market Is Too Pessimistic
While the 37.3 times earnings multiple looks stretched versus a 20.9 times fair ratio, our DCF model paints a different picture, putting fair value at HK$127.35 per share, around 51 percent above today’s HK$62.55 price. Is the market underpricing Henlius cash flow potential?
Look into how the SWS DCF model arrives at its fair value.
Simply Wall St performs a discounted cash flow (DCF) on every stock in the world every day (check out Shanghai Henlius Biotech for example). We show the entire calculation in full. You can track the result in your watchlist or portfolio and be alerted when this changes, or use our stock screener to discover 910 undervalued stocks based on their cash flows. If you save a screener we even alert you when new companies match - so you never miss a potential opportunity.
Build Your Own Shanghai Henlius Biotech Narrative
If you would rather dig into the numbers yourself and challenge any of these assumptions, you can craft a personalised view in minutes: Do it your way.
A great starting point for your Shanghai Henlius Biotech research is our analysis highlighting 3 key rewards and 1 important warning sign that could impact your investment decision.
Ready for your next investing edge?
Before you move on, lock in an information advantage by using the Simply Wall St Screener to uncover fresh stock ideas that match your strategy.
- Capitalize on mispriced opportunities by targeting these 910 undervalued stocks based on cash flows that strong cash flows suggest the market has not fully appreciated yet.
- Ride the next technology wave by zeroing in on these 24 AI penny stocks positioned at the forefront of intelligent automation and data driven innovation.
- Strengthen your income stream by focusing on these 13 dividend stocks with yields > 3% that can potentially add resilience and regular cash payouts to your portfolio.
This article by Simply Wall St is general in nature. We provide commentary based on historical data and analyst forecasts only using an unbiased methodology and our articles are not intended to be financial advice. It does not constitute a recommendation to buy or sell any stock, and does not take account of your objectives, or your financial situation. We aim to bring you long-term focused analysis driven by fundamental data. Note that our analysis may not factor in the latest price-sensitive company announcements or qualitative material. Simply Wall St has no position in any stocks mentioned.
Have feedback on this article? Concerned about the content? Get in touch with us directly. Alternatively, email editorial-team@simplywallst.com