
 Nasdaq
 华尔街日报
华尔街日报DRDGOLD (NYSE:DRD): Assessing Valuation as ERGO Strike Action Raises Operational and Earnings Risks
DRDGOLD (NYSE:DRD) has flagged impending strike action at its ERGO operations from 18 December, as unions push back on wages and profit sharing. This is putting near term output and margins under closer scrutiny.
See our latest analysis for DRDGOLD.
Even with the strike risk grabbing headlines, DRDGOLD’s strong year to date 246.34% share price return, alongside a 261.47% one year total shareholder return, suggests momentum is still firmly on the upside as investors weigh higher operational risk against robust cash generation and gold exposure.
If this kind of volatility has your attention, it could be a good moment to see what else is moving and explore fast growing stocks with high insider ownership.
With earnings still growing, a sizeable intrinsic value discount flagged, and strike risks looming, is DRDGOLD now an overlooked value opportunity for gold bulls, or has the market already priced in the company’s next leg of growth?
Price-to-Earnings of 20.2x: Is it justified?
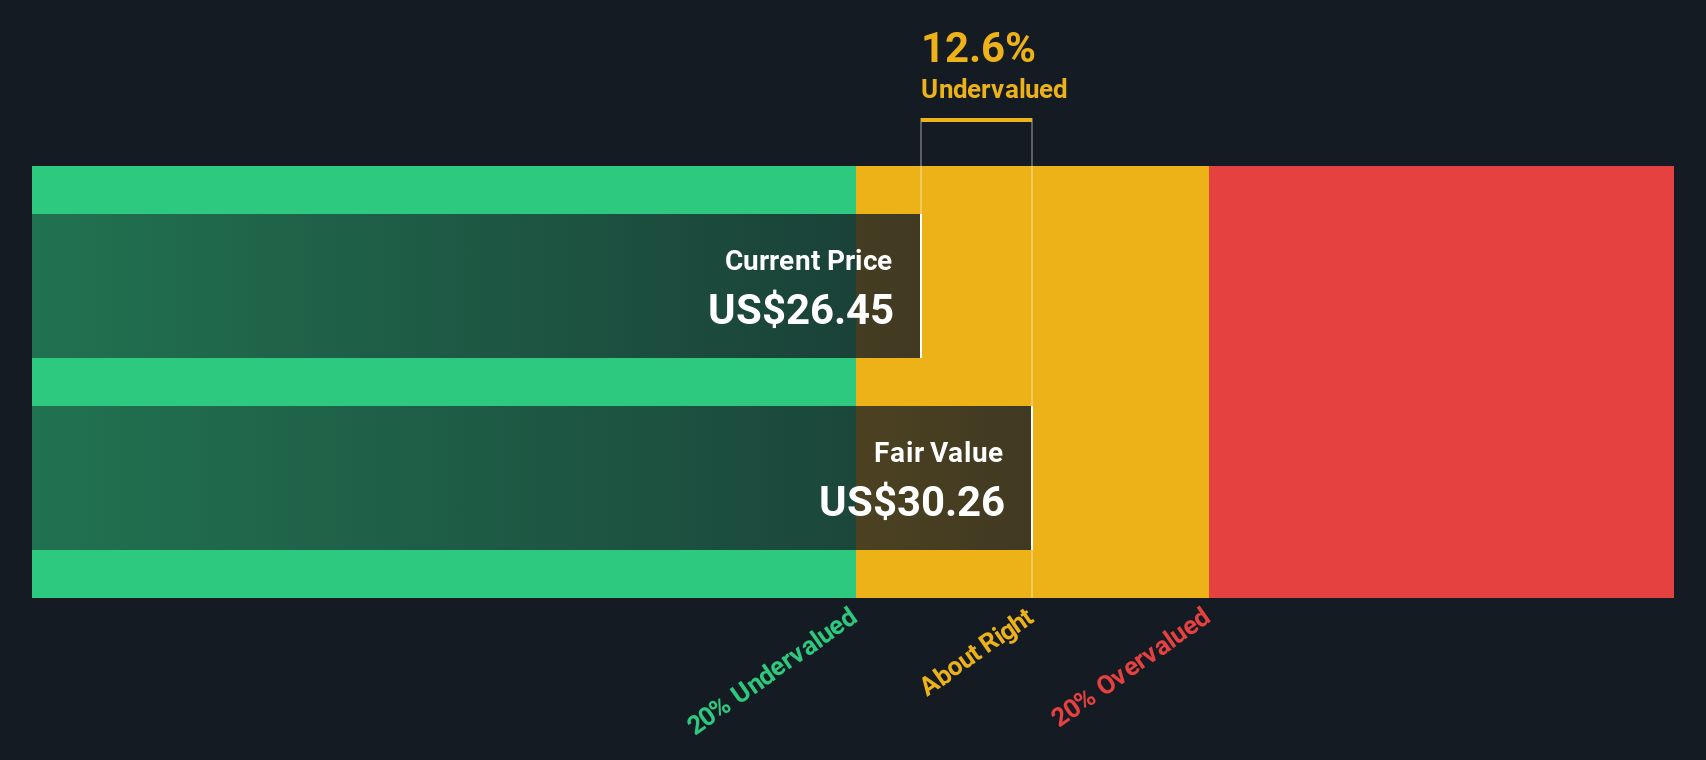
On a last close of $31.24, DRDGOLD screens as undervalued versus both its own cash flow profile and peers when you run the numbers through earnings.
The key yardstick here is the price-to-earnings ratio, which compares the current share price with the company’s per share profits. For a gold tailings retreatment business with strong recent profit growth, this multiple helps indicate how much investors are willing to pay for each unit of current earnings.
According to Simply Wall St’s model, DRDGOLD is trading at a 48.1% discount to its estimated fair value, with the stock at $31.24 versus an internal fair value estimate of $60.14 based on the SWS DCF model. That gap sits alongside a 20.2x price-to-earnings multiple that is below both peer averages and the wider US metals and mining space. This suggests the market may be underpricing how durable recent earnings and margins could prove if forecast revenue growth materialises.
Compared with the US Metals and Mining industry average price-to-earnings of 25.4x, DRDGOLD’s 20.2x multiple looks noticeably cheaper. It also stacks up well against a 23.9x peer group average. The combination of a substantial DCF discount and a below sector earnings multiple points to investors paying less per unit of profit than they do for comparable miners, despite DRDGOLD’s stronger recent earnings trajectory.
See what the numbers say about this price — find out in our valuation breakdown.
Result: Price-to-Earnings of 20.2x (UNDERVALUED)
However, sustained strike disruption or weaker gold prices could quickly compress margins, undermine recent earnings momentum, and challenge the market’s current valuation optimism.
Find out about the key risks to this DRDGOLD narrative.
Another View on Value
Looking at DRDGOLD through the SWS DCF model as a cross check, the picture lines up with the earnings signal rather than contradicting it. With the shares trading around half of the model’s fair value estimate, is the market still underestimating future cash flows?
Look into how the SWS DCF model arrives at its fair value.
Simply Wall St performs a discounted cash flow (DCF) on every stock in the world every day (check out DRDGOLD for example). We show the entire calculation in full. You can track the result in your watchlist or portfolio and be alerted when this changes, or use our stock screener to discover 913 undervalued stocks based on their cash flows. If you save a screener we even alert you when new companies match - so you never miss a potential opportunity.
Build Your Own DRDGOLD Narrative
If you would rather dig into the numbers yourself and shape a view that fits your own research process, you can build a personalised take in just a few minutes: Do it your way.
A great starting point for your DRDGOLD research is our analysis highlighting 3 key rewards and 1 important warning sign that could impact your investment decision.
Looking for more investment ideas?
If you stop with DRDGOLD, you could miss out on other powerful setups, so use the Simply Wall St Screener to hunt fresh opportunities before others react.
- Unlock growth potential by scanning these 913 undervalued stocks based on cash flows that still trade at compelling discounts despite strong fundamentals and solid cash flow prospects.
- Position yourself ahead of innovation waves by targeting these 24 AI penny stocks that are turning artificial intelligence into real, scalable revenue.
- Strengthen your income stream by zeroing in on these 13 dividend stocks with yields > 3% that combine attractive yields with balance sheets built for resilience.
This article by Simply Wall St is general in nature. We provide commentary based on historical data and analyst forecasts only using an unbiased methodology and our articles are not intended to be financial advice. It does not constitute a recommendation to buy or sell any stock, and does not take account of your objectives, or your financial situation. We aim to bring you long-term focused analysis driven by fundamental data. Note that our analysis may not factor in the latest price-sensitive company announcements or qualitative material. Simply Wall St has no position in any stocks mentioned.
Have feedback on this article? Concerned about the content? Get in touch with us directly. Alternatively, email editorial-team@simplywallst.com