
 Nasdaq
 华尔街日报
华尔街日报Criteo’s 50% Slump in 2024 Raises Big Questions About Its True Value
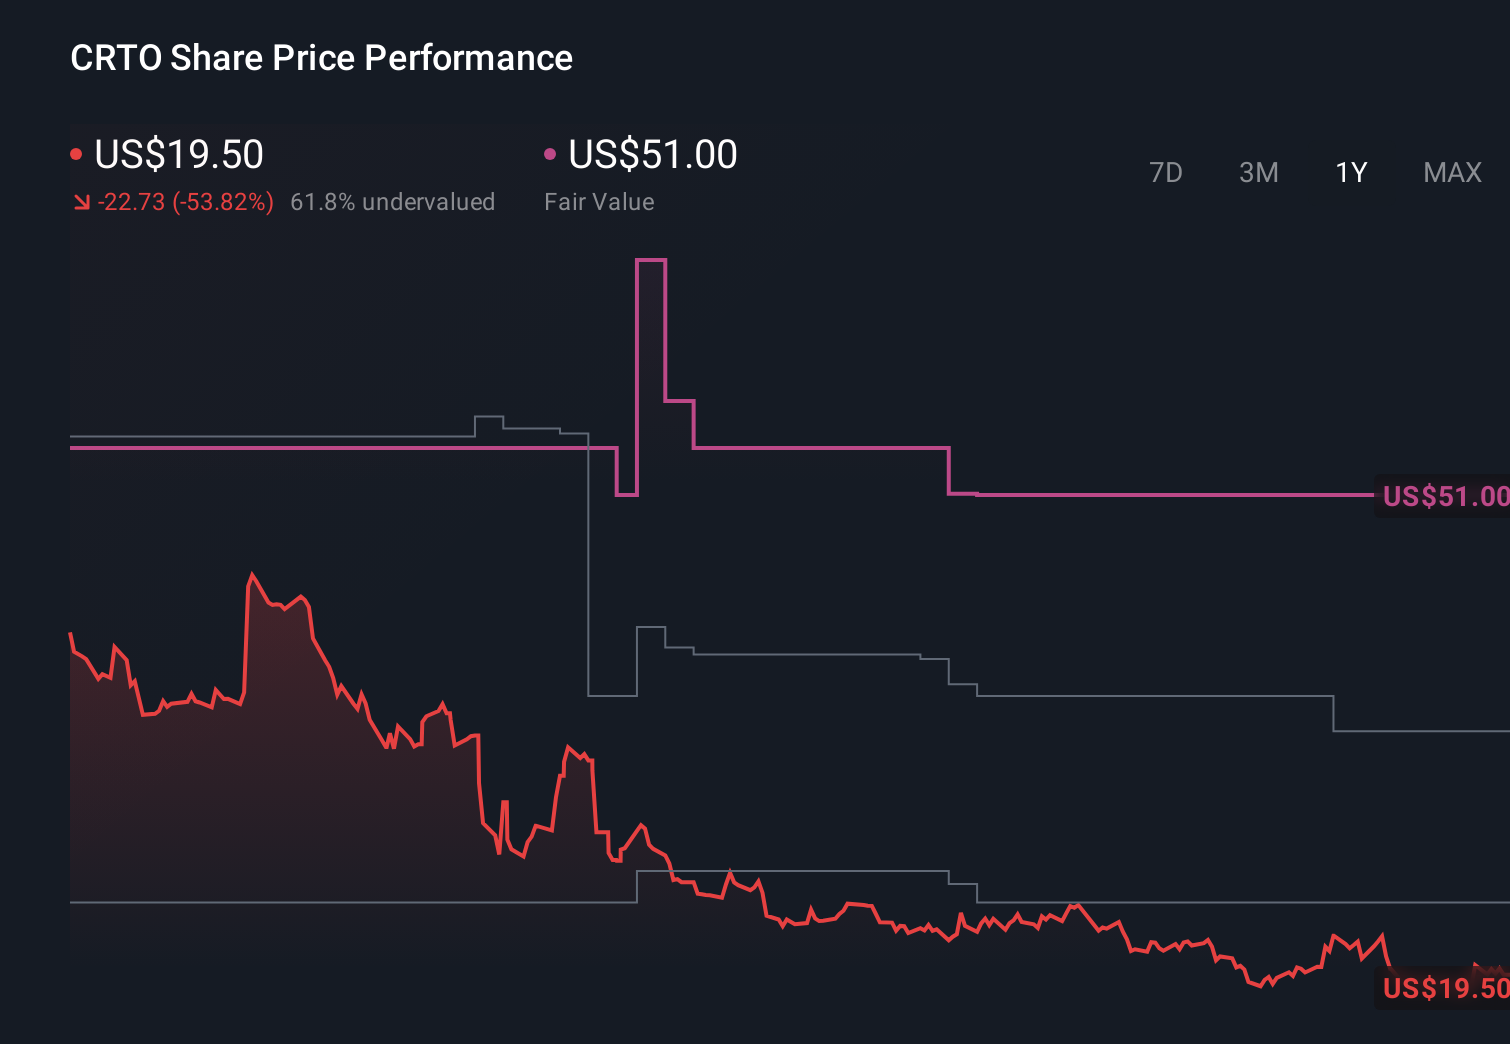
- If you are wondering whether Criteo at around $19.50 is a beaten down ad tech name or a quiet value opportunity hiding in plain sight, this piece is for you.
- The stock is down 4.4% over the last week, 1.9% over the last month, and a steep 50.4% year to date, compounding into a 55.1% slide over the past year that has dramatically reset expectations.
- Recent headlines have centered on Criteo's ongoing pivot toward a broader commerce media platform. This includes deepening retail media partnerships and expanding its first party data solutions as third party cookies fade. At the same time, the market has been rethinking how to price ad tech businesses exposed to shifting privacy rules and changing digital ad budgets.
- Despite that pessimism, Criteo scores a solid 5 out of 6 on our undervaluation checks. We will unpack this using multiple valuation lenses before closing with an intuitive way to think about what the stock might really be worth.
Find out why Criteo's -55.1% return over the last year is lagging behind its peers.
Approach 1: Criteo Discounted Cash Flow (DCF) Analysis
A Discounted Cash Flow model estimates what a business is worth today by projecting the cash it can generate in the future and discounting those cash flows back to the present. For Criteo, the model uses a 2 stage Free Cash Flow to Equity framework built on cash flow projections.
Criteo generated trailing twelve month free cash flow of about $217.9 Million. Analyst forecasts, supplemented by Simply Wall St extrapolations after year five, see free cash flow rising to around $377.5 Million by 2035, with interim estimates such as $181.9 Million in 2026 and $276.6 Million in 2029. These figures suggest moderate but steady growth in the underlying cash engine over the next decade.
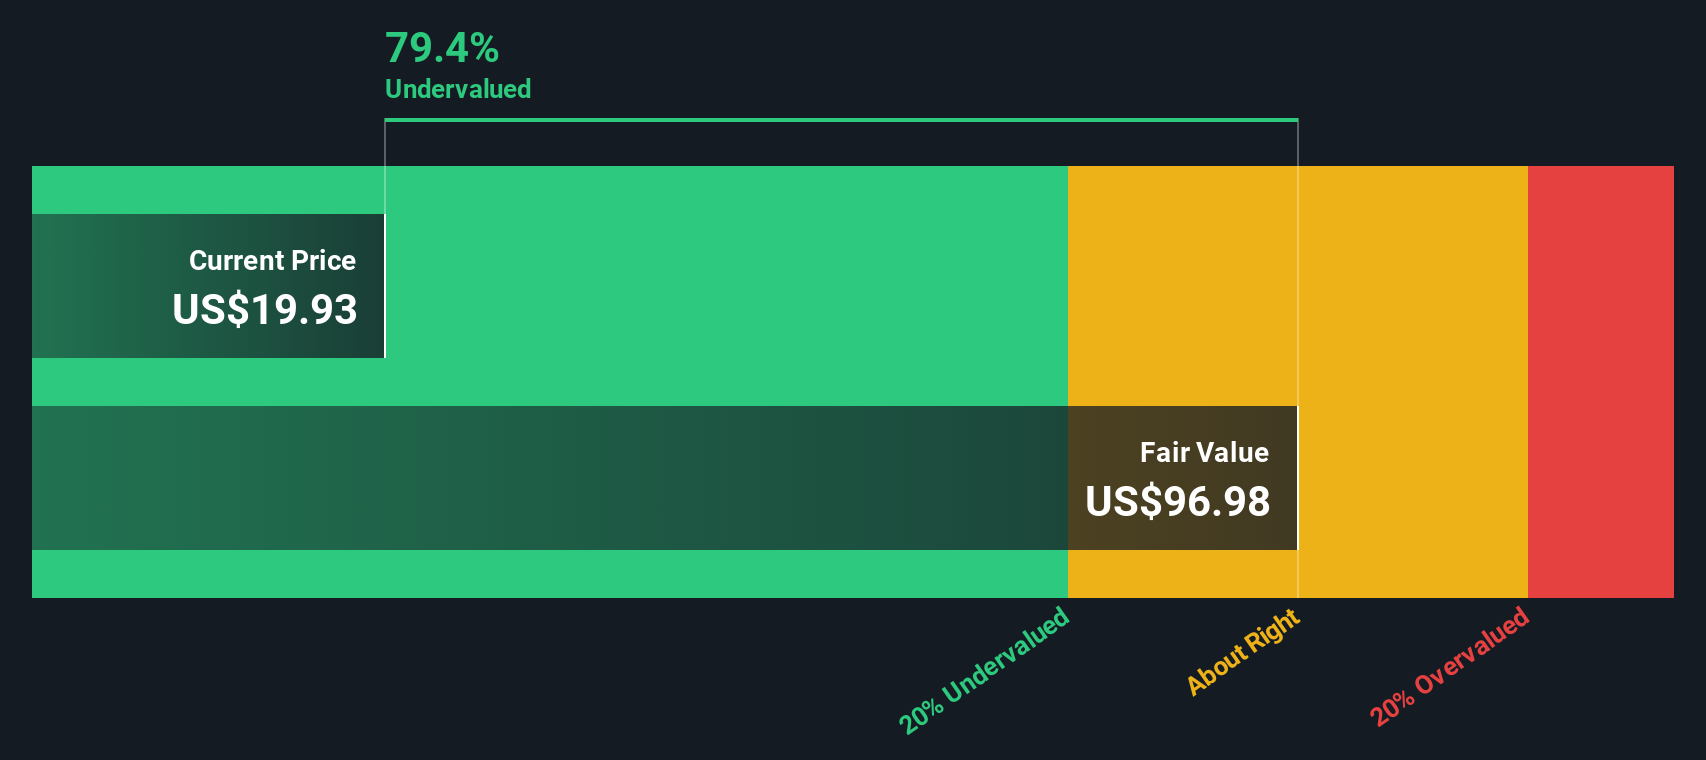
When those projected cash flows are discounted back to today, the DCF model arrives at an estimated intrinsic value of roughly $127 per share. Compared with the recent share price near $19.50, the analysis implies Criteo could be about 84.6% undervalued on a cash flow basis, indicating a wide gap between market price and modeled value.
Result: UNDERVALUED
Our Discounted Cash Flow (DCF) analysis suggests Criteo is undervalued by 84.6%. Track this in your watchlist or portfolio, or discover 913 more undervalued stocks based on cash flows.
Approach 2: Criteo Price vs Earnings
For profitable companies like Criteo, the price to earnings ratio is a straightforward way to gauge how much investors are willing to pay for each dollar of current earnings. It ties directly to the bottom line that ultimately supports shareholder returns, making it a practical anchor for valuation.
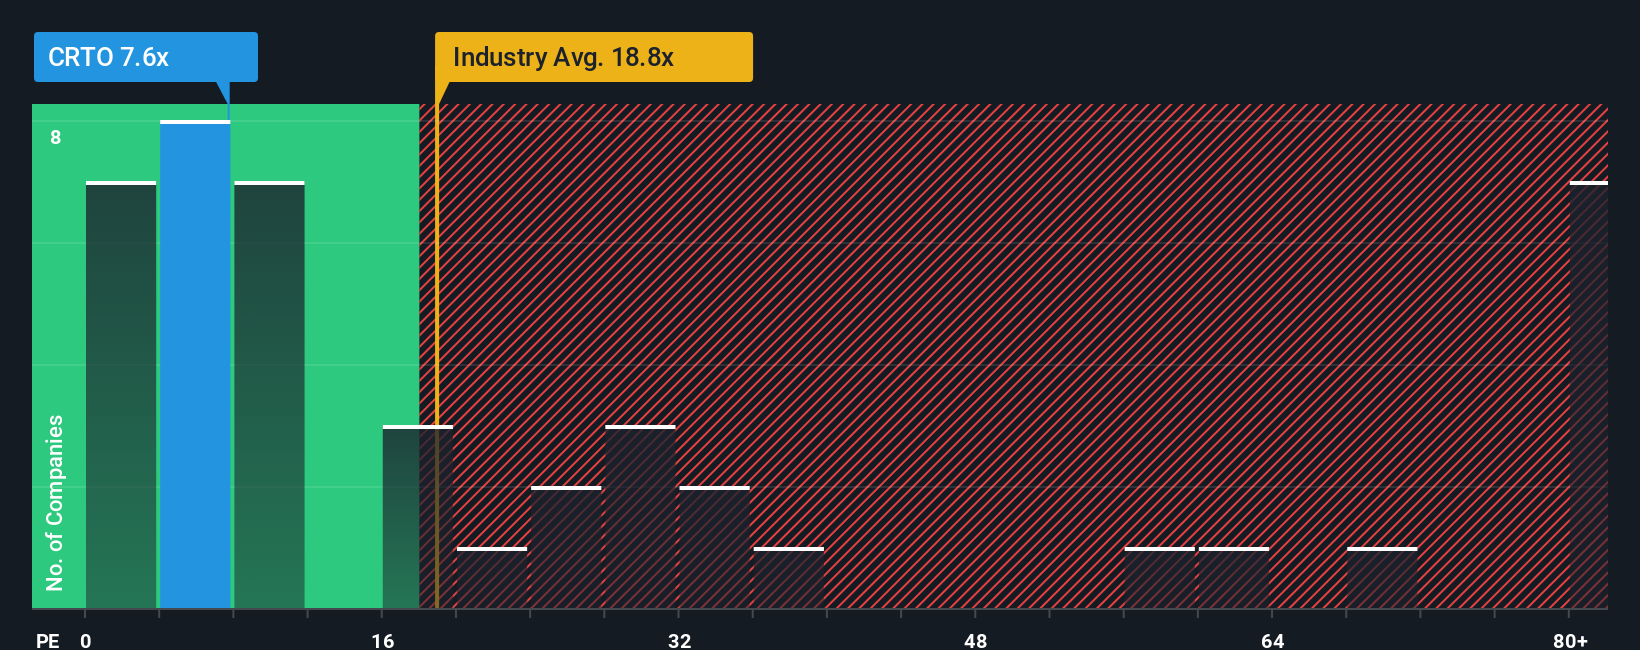
What counts as a fair PE ratio depends on how quickly earnings are expected to grow and how risky that growth appears. Higher growth and lower perceived risk usually justify a higher multiple, while slower or more uncertain growth tends to pull the multiple down. Criteo currently trades at about 6.10x earnings, which is well below the Media industry average of roughly 16.04x and far under the broader peer group average of about 86.39x. Simply Wall St’s Fair Ratio framework, which estimates what the PE should be after considering Criteo’s growth profile, margins, industry, size, and risk, points to a fair PE of roughly 12.54x. This company specific yardstick is more informative than a blunt comparison with peers or the sector because it adjusts for Criteo’s own fundamentals rather than assuming it should trade like the average ad tech name. With the current 6.10x multiple sitting meaningfully below the 12.54x Fair Ratio, the stock screens as undervalued on earnings.
Result: UNDERVALUED
PE ratios tell one story, but what if the real opportunity lies elsewhere? Discover 1463 companies where insiders are betting big on explosive growth.
Upgrade Your Decision Making: Choose your Criteo Narrative
Earlier we mentioned that there is an even better way to understand valuation. Let's introduce you to Narratives, which Simply Wall St provides on the Community page as an easy tool for turning your view of a company into a simple story. This story links Criteo's business drivers to a set of forecasts and then to a Fair Value you can compare against the current share price to decide whether to buy, hold, or sell. That Fair Value automatically updates as new earnings or news arrives. One investor might build a bullish Criteo Narrative around retail media momentum and AI, arriving at a Fair Value closer to the top of the current analyst range near $51. Another might focus on competitive risk and slower growth, landing nearer the low end around $25. Both are using the same structure, just with different assumptions powering their own, clearly articulated stories behind the numbers.
Do you think there's more to the story for Criteo? Head over to our Community to see what others are saying!
This article by Simply Wall St is general in nature. We provide commentary based on historical data and analyst forecasts only using an unbiased methodology and our articles are not intended to be financial advice. It does not constitute a recommendation to buy or sell any stock, and does not take account of your objectives, or your financial situation. We aim to bring you long-term focused analysis driven by fundamental data. Note that our analysis may not factor in the latest price-sensitive company announcements or qualitative material. Simply Wall St has no position in any stocks mentioned.
Have feedback on this article? Concerned about the content? Get in touch with us directly. Alternatively, email editorial-team@simplywallst.com