
 Nasdaq
 华尔街日报
华尔街日报Has AppFolio’s Share Price Already Reflected Its Long Term Growth Prospects in 2025?
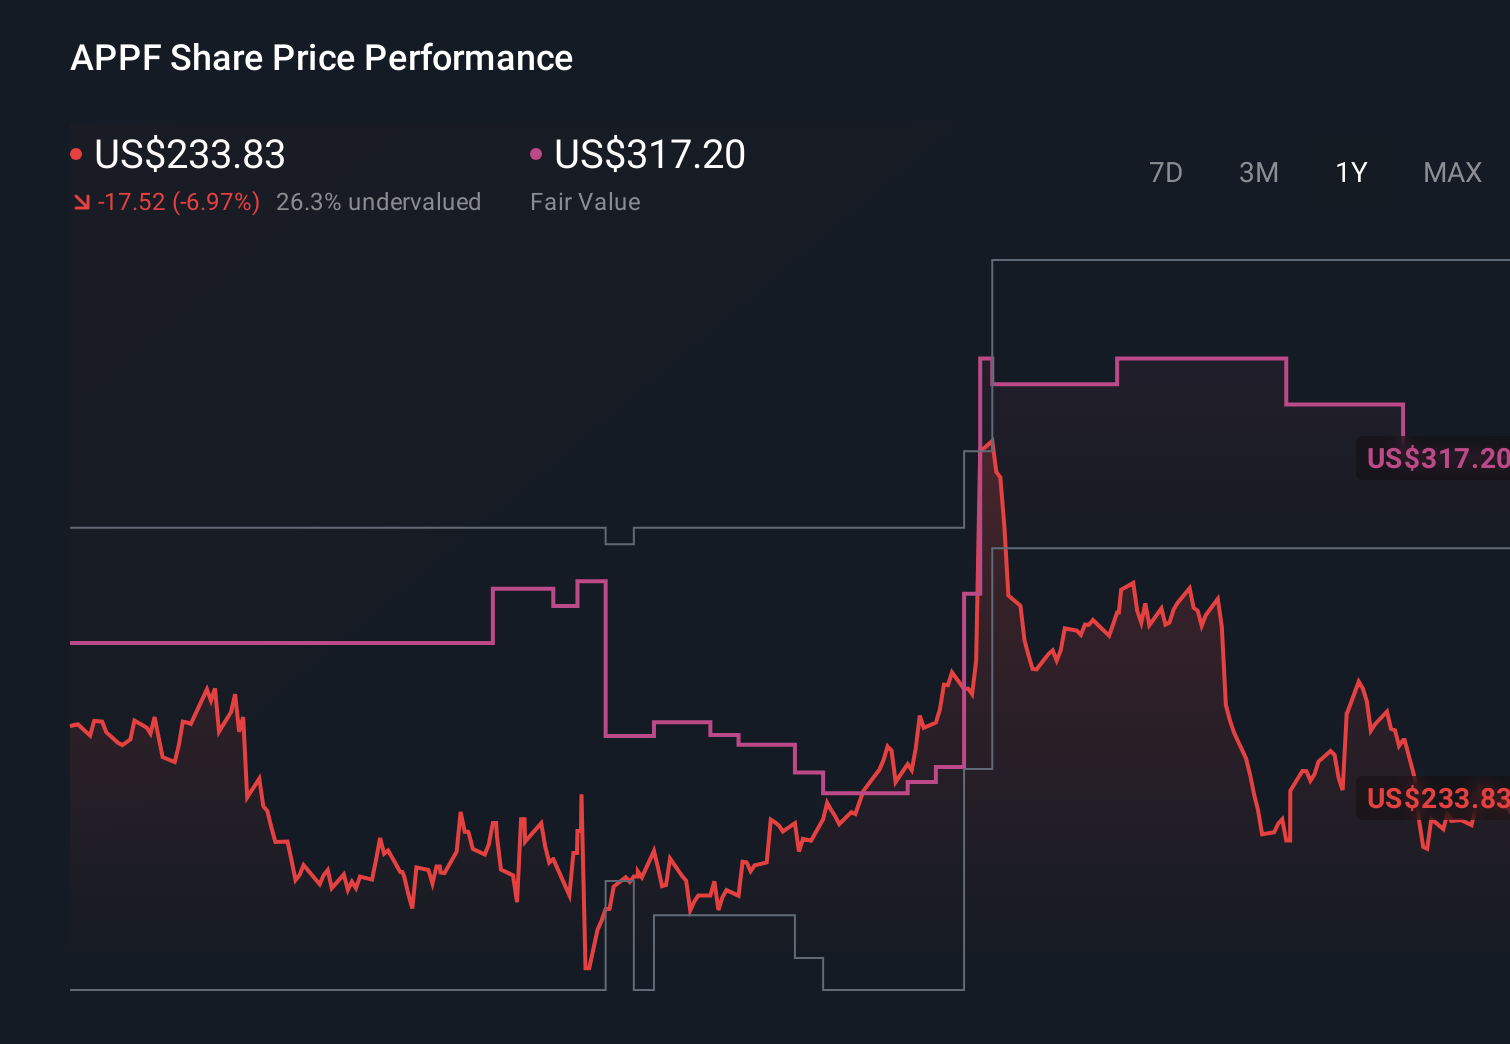
- Wondering if AppFolio at around $233 a share is still a smart buy, or if most of the upside is already priced in? Let us break down what the market might be implying about its long term potential.
- Despite being down 5.8% year to date and 7.2% over the last year, the stock has still delivered a 123.5% return over 3 years and 29.4% over 5 years, which shows that investors have rewarded the story over time, even if momentum has cooled recently.
- Recent interest has centered on AppFolio's continued expansion of its cloud based property management platform and its push into value added services for landlords and property managers. These moves have reinforced the narrative that AppFolio is more than just software; it is building a broader ecosystem that could justify a premium multiple over the long run.
- Right now, AppFolio scores 1 out of 6 on our undervaluation checks, which might make it look expensive at first glance. In the next sections we will dig into different valuation lenses and, by the end, explore a more nuanced way to think about what this business might be worth.
AppFolio scores just 1/6 on our valuation checks. See what other red flags we found in the full valuation breakdown.
Approach 1: AppFolio Discounted Cash Flow (DCF) Analysis
A Discounted Cash Flow model estimates what a business is worth by projecting the cash it can generate in the future and discounting those cash flows back to today in dollar terms.
For AppFolio, the model starts with last twelve month Free Cash Flow of about $201.5 million and uses a 2 Stage Free Cash Flow to Equity approach. Analysts provide detailed estimates for the next few years. Beyond that, Simply Wall St extrapolates cash flows, reaching projected Free Cash Flow of roughly $553.5 million in 2035.
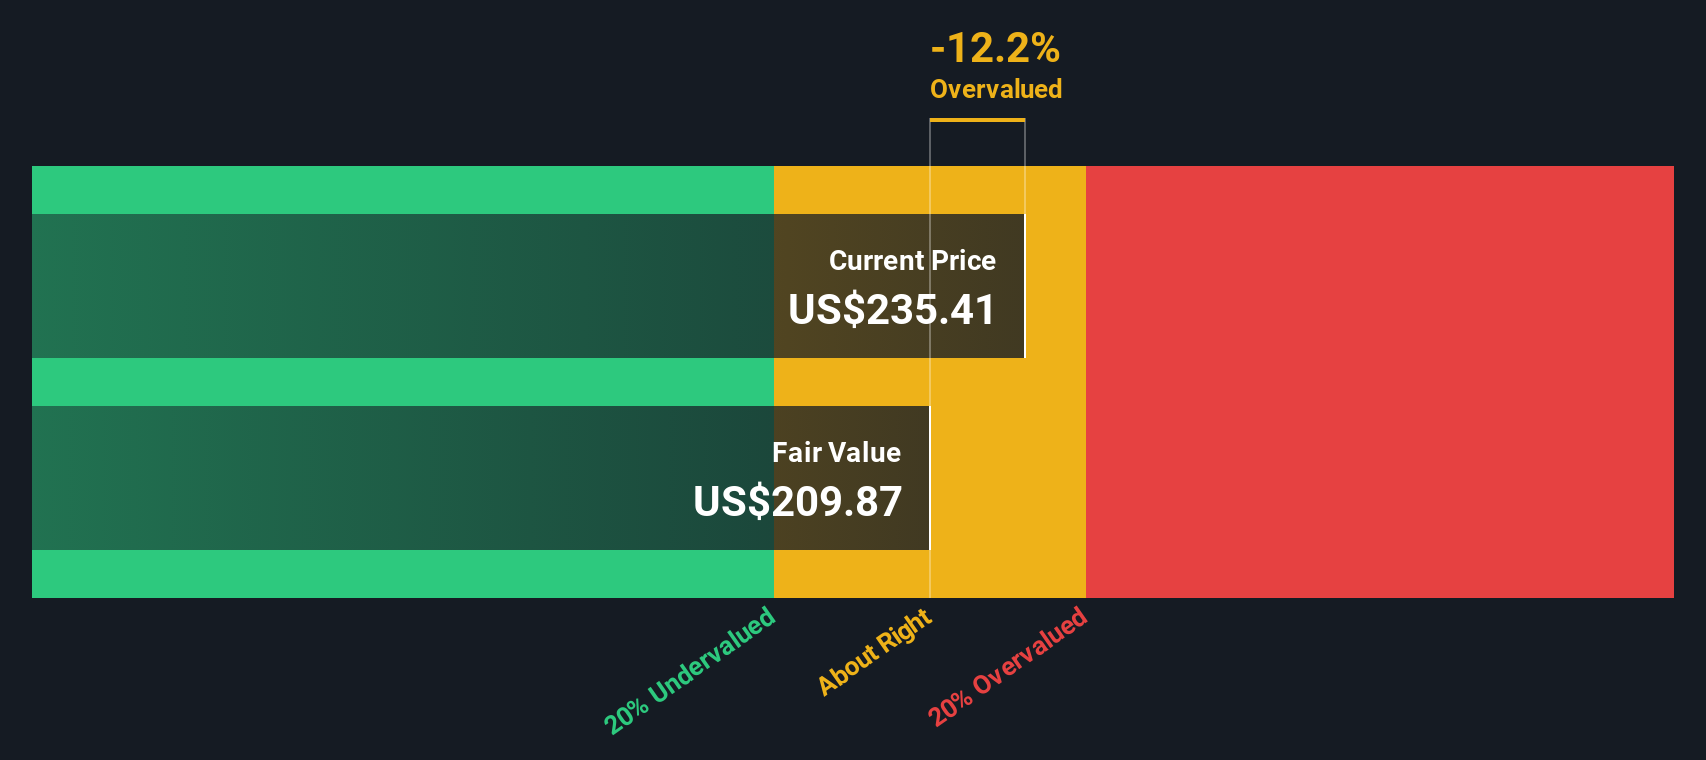
When all those future dollar cash flows are discounted back, the DCF suggests an intrinsic value of about $211.37 per share. Compared with the current share price around $233, that implies the stock is roughly 10.6% overvalued on this model. In other words, the market already factors in a lot of future growth, which leaves a limited margin of safety at today’s price.
Result: OVERVALUED
Our Discounted Cash Flow (DCF) analysis suggests AppFolio may be overvalued by 10.6%. Discover 913 undervalued stocks or create your own screener to find better value opportunities.
Approach 2: AppFolio Price vs Earnings
For profitable software companies like AppFolio, the Price to Earnings (PE) ratio is a useful way to gauge how much investors are willing to pay today for each dollar of current earnings. It links directly to the bottom line, which ultimately funds future reinvestment, acquisitions, or returns to shareholders.
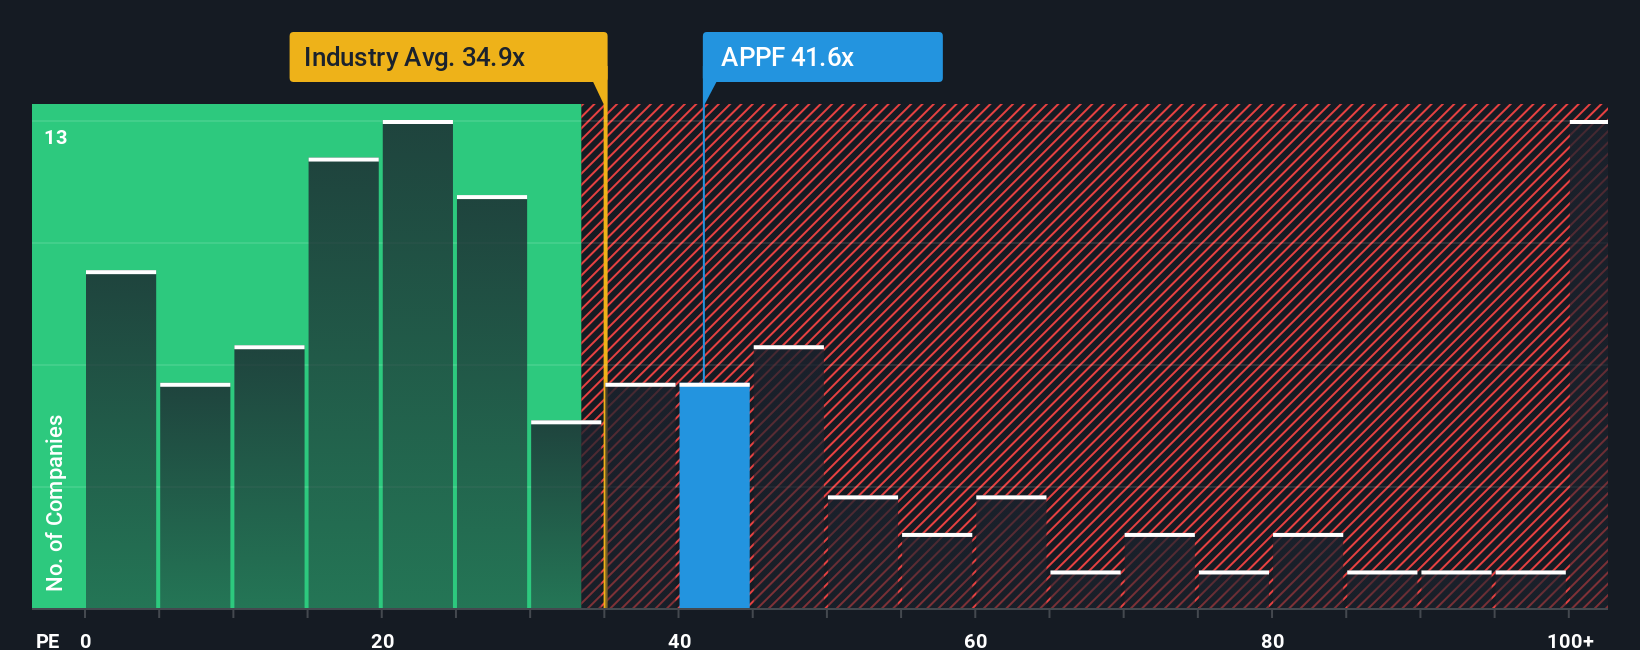
What counts as a fair PE depends on how fast earnings are expected to grow and how risky those earnings are. Higher growth and stronger competitive positioning can justify a higher multiple, while more uncertainty or cyclicality usually commands a lower one. AppFolio currently trades at about 41.2x earnings, which is above both the broader Software industry average of roughly 32.4x and the peer group average of about 24.8x.
Simply Wall St’s Fair Ratio of 27.3x is a proprietary estimate of what PE might be appropriate for AppFolio given its earnings growth, margins, industry, market cap, and risk profile. Because it blends these company specific drivers rather than relying only on broad peer or industry comparisons, it gives a more tailored view of value. With the actual PE of 41.2x sitting well above the 27.3x Fair Ratio, the multiple based view points to AppFolio being meaningfully overvalued at current levels.
Result: OVERVALUED
PE ratios tell one story, but what if the real opportunity lies elsewhere? Discover 1463 companies where insiders are betting big on explosive growth.
Upgrade Your Decision Making: Choose your AppFolio Narrative
Earlier we mentioned that there is an even better way to understand valuation, so let us introduce you to Narratives, a simple framework that lets you write the story behind your numbers by connecting your assumptions for AppFolio’s future revenue, earnings, and margins to a clear fair value estimate.
A Narrative on Simply Wall St links three things together: the company’s story, a set of financial forecasts based on that story, and the fair value that naturally falls out of those forecasts, so you can see in one place what needs to be true for your view to make sense.
These Narratives live inside the Community page on Simply Wall St, are used by millions of investors, and give you an accessible way to compare each Narrative’s Fair Value with today’s AppFolio share price.
Because Narratives update dynamically when new information arrives, such as earnings releases, product announcements, or major news, you can immediately see how fresh data shifts the outlook and whether your fair value still stacks up.
For example, one AppFolio Narrative on the platform might assume strong AI driven adoption and assign a fair value closer to $341.50, while a more cautious Narrative, focused on competition and margin pressure, might land nearer $211.37. Comparing these perspectives can help you clarify what you personally believe is most likely.
Do you think there's more to the story for AppFolio? Head over to our Community to see what others are saying!
This article by Simply Wall St is general in nature. We provide commentary based on historical data and analyst forecasts only using an unbiased methodology and our articles are not intended to be financial advice. It does not constitute a recommendation to buy or sell any stock, and does not take account of your objectives, or your financial situation. We aim to bring you long-term focused analysis driven by fundamental data. Note that our analysis may not factor in the latest price-sensitive company announcements or qualitative material. Simply Wall St has no position in any stocks mentioned.
Have feedback on this article? Concerned about the content? Get in touch with us directly. Alternatively, email editorial-team@simplywallst.com