
 Nasdaq
 华尔街日报
华尔街日报Has AST SpaceMobile’s 2025 Surge Outrun Its Fundamentals After DCF and Book Value Checks?
- If you are wondering whether AST SpaceMobile is still a smart bet after its huge run up, you are not alone. This is exactly the kind of stock where valuation really matters.
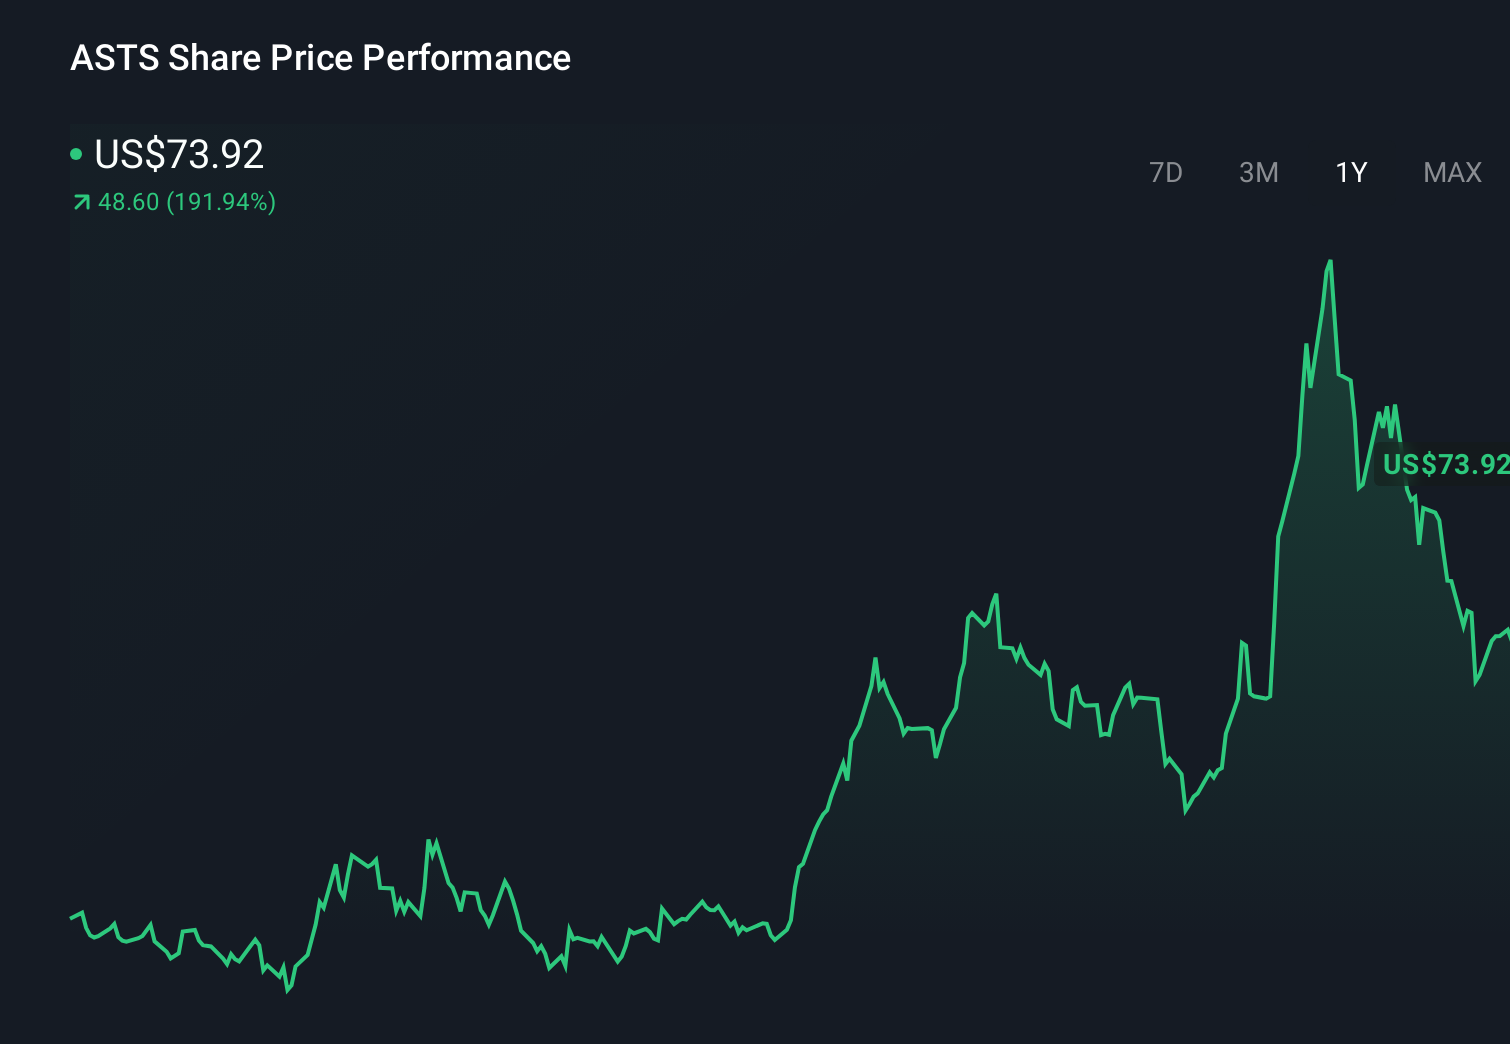
- The share price has been on a wild ride, up about 30.7% over the last month, 250.5% year to date and an eye catching 1810.3% over three years, even with a small 1.1% dip in the past week.
- Those moves have been fueled by excitement around AST SpaceMobile's plan to build a space based cellular broadband network that connects directly to standard smartphones, and by high profile partnership announcements with major mobile network operators that keep the story in the spotlight. At the same time, investors are weighing the capital intensive rollout, regulatory milestones and execution risk that come with turning a bold vision into a commercial service.
- Right now, AST SpaceMobile scores just 2/6 on our valuation checks. This suggests some parts of the market are pricing in a lot of future success, while other metrics still hint at upside. Next we will walk through the main valuation approaches behind that score, then finish with a more holistic way to think about what this stock is really worth long term.
AST SpaceMobile scores just 2/6 on our valuation checks. See what other red flags we found in the full valuation breakdown.
Approach 1: AST SpaceMobile Discounted Cash Flow (DCF) Analysis
A Discounted Cash Flow model takes forecasts of a company’s future cash flows and discounts them back to today, aiming to estimate what the entire business is worth in current dollar terms.
For AST SpaceMobile, the latest twelve month Free Cash Flow is deeply negative at about $1,078 million, reflecting the heavy investment phase. Analyst forecasts and extrapolations in the model show cash flow moving from an outflow of roughly $1,115 million in 2026 to positive territory by 2028, then reaching around $4,396 million by 2035 as the network scales within the assumptions used.
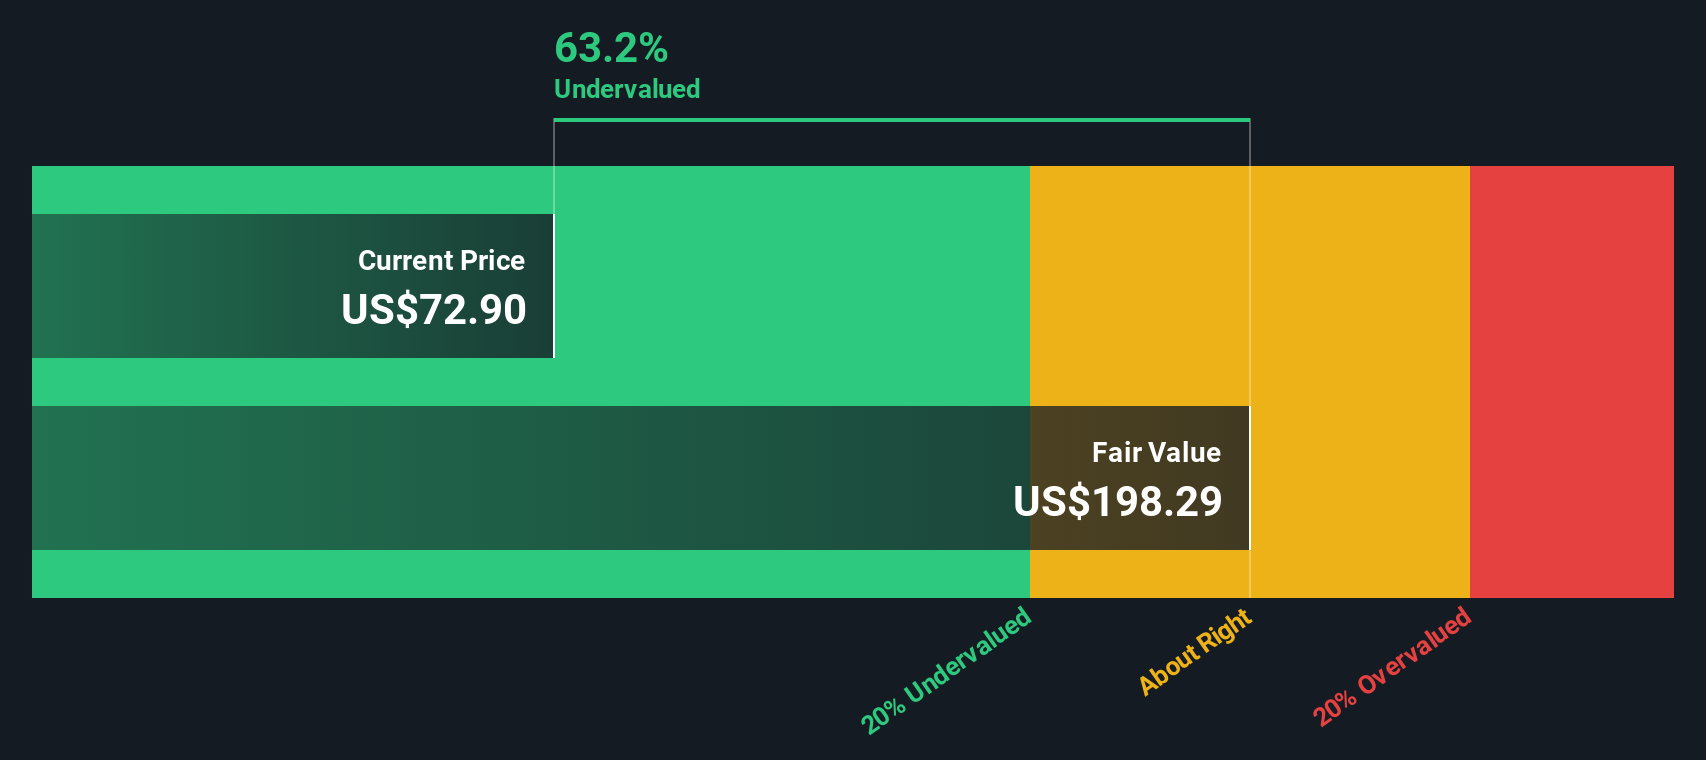
Using a 2 Stage Free Cash Flow to Equity model, these projected cash flows over the next decade are discounted back to the present and combined with a terminal value. This yields an estimated intrinsic value of about $194.42 per share, which is roughly 61.0% above the current market price implied by the model, indicating that the stock screens as significantly undervalued under these specific assumptions.
Result: UNDERVALUED (model-based)
Our Discounted Cash Flow (DCF) analysis suggests AST SpaceMobile is undervalued by 61.0%. Track this in your watchlist or portfolio, or discover 913 more undervalued stocks based on cash flows.
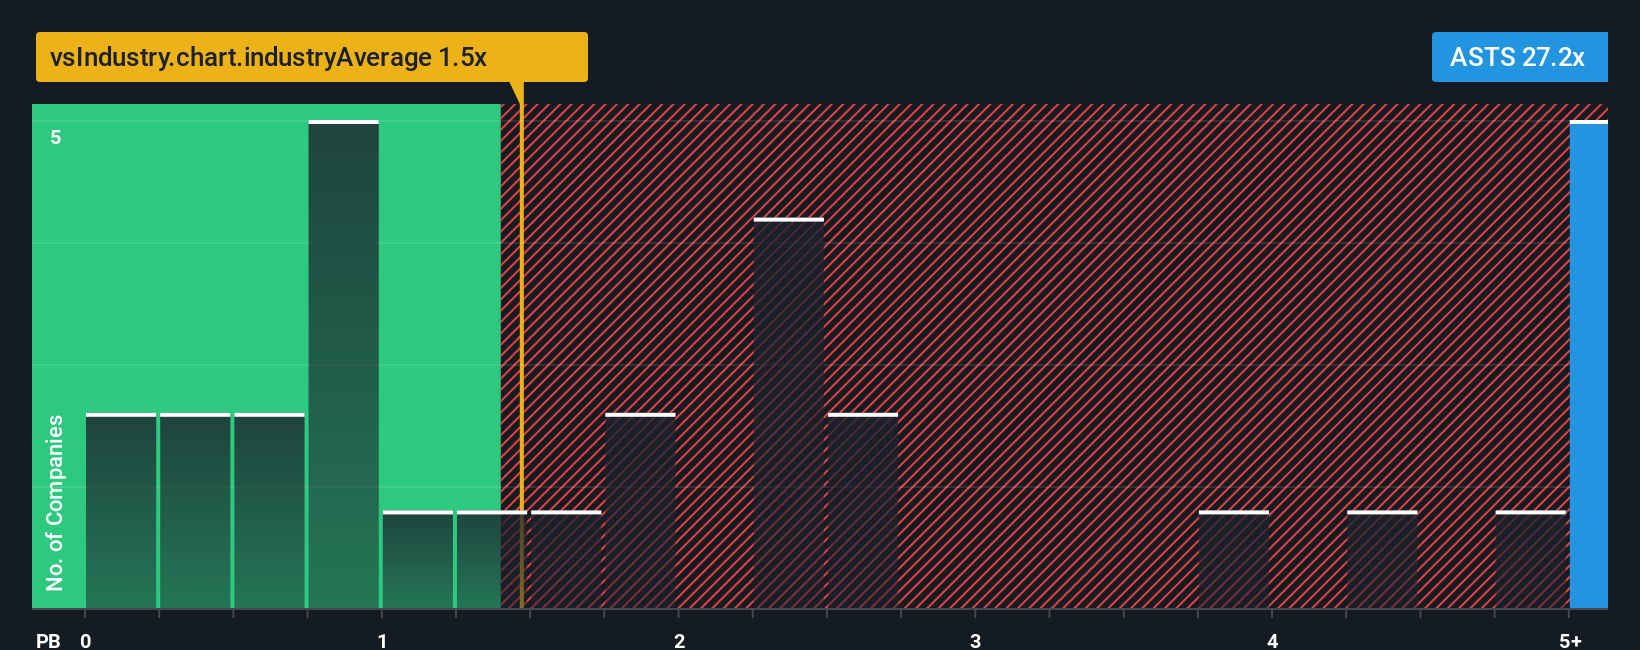
Approach 2: AST SpaceMobile Price vs Book
For early stage or unprofitable businesses, earnings based metrics are not very meaningful, so investors often lean on asset based measures like the price to book ratio to anchor valuation. In simple terms, this compares what the market is paying for each dollar of net assets on the balance sheet.
What counts as a reasonable or fair multiple depends on how quickly a company is expected to grow and how risky that journey looks. Faster growth and stronger competitive advantages can justify paying a higher multiple, while greater execution, funding or regulatory risk normally pulls that multiple down.
AST SpaceMobile currently trades at about 17.17x book value, far above the broader Telecom industry average of roughly 1.09x and also well ahead of its peer group average of around 6.34x. Simply Wall St’s proprietary Fair Ratio framework goes a step further by estimating the price to book multiple that would be warranted given AST SpaceMobile’s specific profile, including its growth outlook, profitability trajectory, risk factors, industry and market capitalization. Because this Fair Ratio explicitly adjusts for those company level drivers, it is a more tailored benchmark than simple peer or sector comparisons. On this basis, AST SpaceMobile’s current 17.17x multiple implies the shares are trading ahead of what would typically be justified by fundamentals.
Result: OVERVALUED
PB ratios tell one story, but what if the real opportunity lies elsewhere? Discover 1463 companies where insiders are betting big on explosive growth.
Upgrade Your Decision Making: Choose your AST SpaceMobile Narrative
Earlier we mentioned that there is an even better way to understand valuation, so let us introduce you to Narratives, a simple way to connect your view of a company’s story with the numbers behind its future. A Narrative is your own investment storyline, where you set expectations for AST SpaceMobile’s future revenue, earnings and margins, and those assumptions are turned into a financial forecast and then into a fair value estimate. On Simply Wall St, Narratives are easy to create and explore on the Community page, where millions of investors share how their stories translate into valuations and compare those fair values with the current share price to decide whether to buy, hold or sell. Because Narratives are updated dynamically as new information, such as fresh earnings or regulatory news, is released, they stay aligned with the latest developments. For AST SpaceMobile, one investor might build a Narrative that assumes rapid global adoption and a very high fair value, while another might factor in slower rollout and funding risks and arrive at a much lower valuation.
Do you think there's more to the story for AST SpaceMobile? Head over to our Community to see what others are saying!
This article by Simply Wall St is general in nature. We provide commentary based on historical data and analyst forecasts only using an unbiased methodology and our articles are not intended to be financial advice. It does not constitute a recommendation to buy or sell any stock, and does not take account of your objectives, or your financial situation. We aim to bring you long-term focused analysis driven by fundamental data. Note that our analysis may not factor in the latest price-sensitive company announcements or qualitative material. Simply Wall St has no position in any stocks mentioned.
Have feedback on this article? Concerned about the content? Get in touch with us directly. Alternatively, email editorial-team@simplywallst.com