
 Nasdaq
 华尔街日报
华尔街日报Is It Too Late To Consider Lundin Mining After Its 125% 2025 Share Price Surge?
- If you are wondering whether Lundin Mining is still worth buying after its huge run, you are not alone. This is exactly the question we are going to unpack.
- The stock has climbed about 4.0% over the last week, 9.4% over the past month, and an eye-catching 125.1% year to date, with a massive 131.9% gain over the last year and 263.3% over three years.
- These moves have been underpinned by a stronger outlook for copper and other base metals, plus renewed investor interest in miners with growth projects and solid balance sheets. In addition, sector wide optimism around long term electrification demand has helped re-rate names like Lundin Mining as investors reassess risk and reward.
- Despite all that momentum, Lundin Mining currently scores just 0 out of 6 on our undervaluation checks. Next we will walk through the main valuation approaches behind that score and hint at an even better way to think about what the stock might really be worth by the end of this article.
Lundin Mining scores just 0/6 on our valuation checks. See what other red flags we found in the full valuation breakdown.
Approach 1: Lundin Mining Dividend Discount Model (DDM) Analysis
The Dividend Discount Model estimates what a stock is worth today by projecting all future dividends a company is expected to pay and discounting them back to a present value. It is best suited to businesses with relatively stable, sustainable dividend policies.
For Lundin Mining, the model starts with its current annual dividend per share of about $0.08 and an estimated return on equity of roughly 4.7%. With a payout ratio near 74%, only about a quarter of earnings are being retained to drive future growth. This translates into a modest implied long term dividend growth rate of roughly 1.2%, calculated as the product of retained earnings and return on equity.
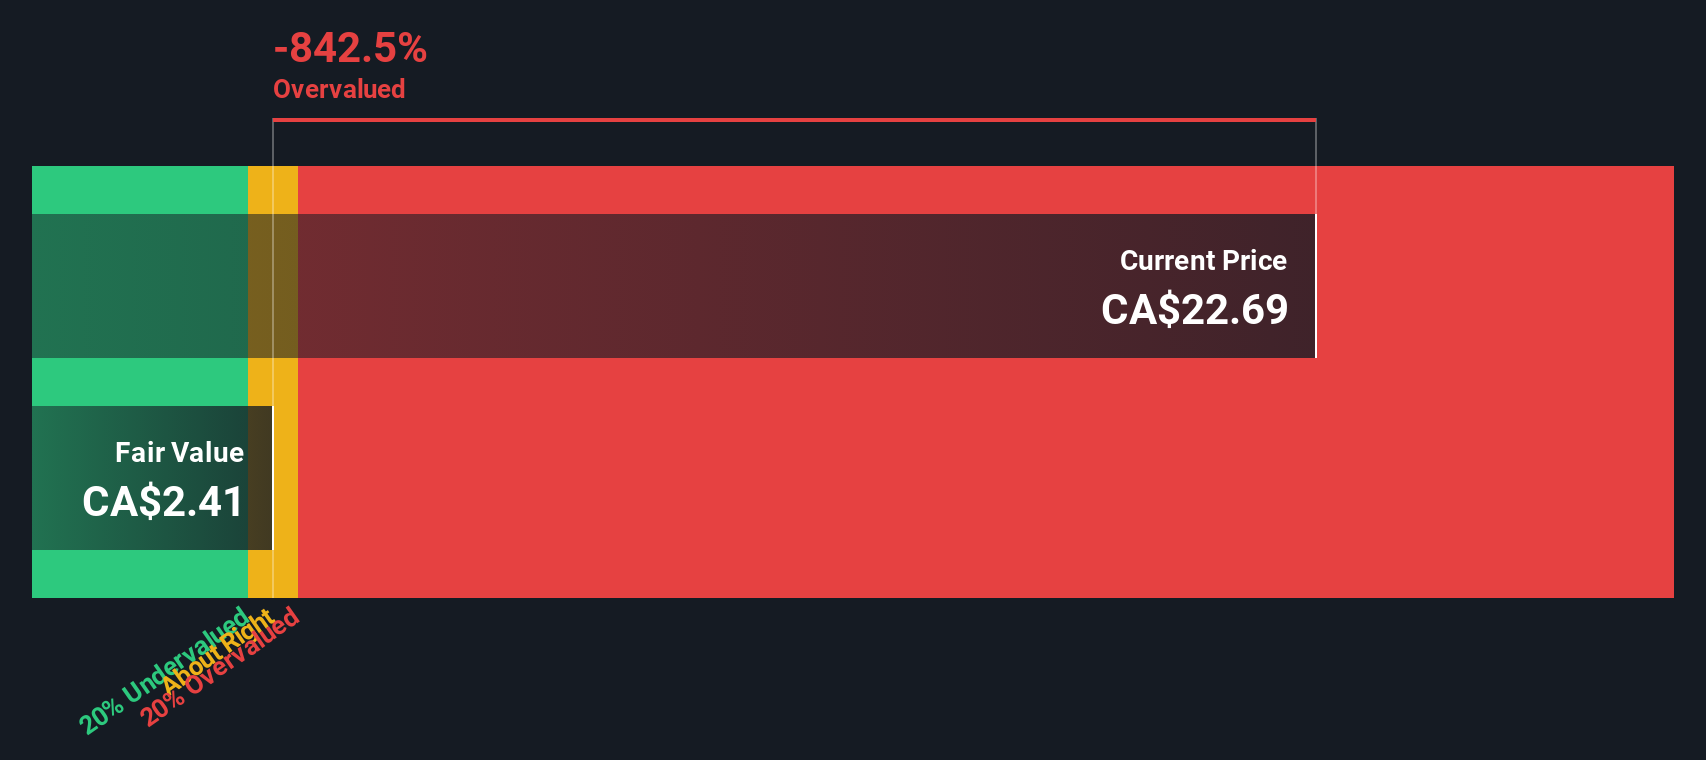
Feeding these inputs into the DDM produces an intrinsic value estimate of about $1.83 per share. Compared with the current market price, this implies the stock is roughly 1444.3% above the model’s fair value, signalling that the shares look extremely stretched on a dividend based lens.
Result: OVERVALUED
Our Dividend Discount Model (DDM) analysis suggests Lundin Mining may be overvalued by 1444.3%. Discover 913 undervalued stocks or create your own screener to find better value opportunities.
Approach 2: Lundin Mining Price vs Earnings
For profitable companies like Lundin Mining, the price to earnings (PE) ratio is a straightforward way to gauge how much investors are paying for each dollar of current profits. A higher PE can be justified when the market expects stronger, more reliable growth in earnings, while weaker outlooks or higher risk usually warrant a lower, more conservative multiple.
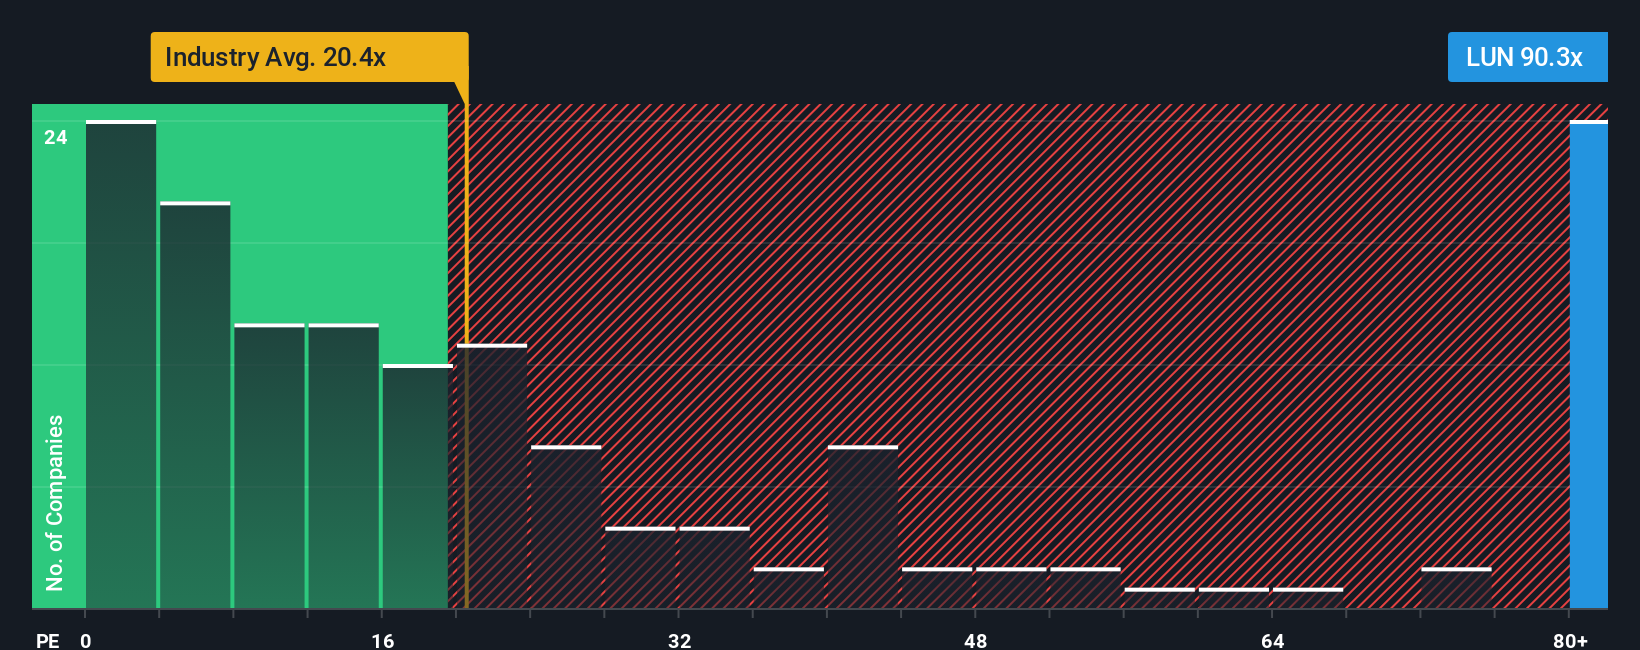
Lundin Mining currently trades on a PE of about 82.8x, which is far above the Metals and Mining industry average of roughly 21.2x and also above the peer group average of around 20.5x. On the surface, that premium suggests the market is pricing in very optimistic expectations versus typical miners.
Simply Wall St’s Fair Ratio framework refines this comparison by estimating what PE multiple would be reasonable given Lundin Mining’s own growth prospects, profitability, risk profile, market cap and industry context. For Lundin Mining, that Fair Ratio is about 23.9x, meaning that even after adjusting for its specific characteristics, the current PE still looks rich relative to what would normally be justified.
Result: OVERVALUED
PE ratios tell one story, but what if the real opportunity lies elsewhere? Discover 1463 companies where insiders are betting big on explosive growth.
Upgrade Your Decision Making: Choose your Lundin Mining Narrative
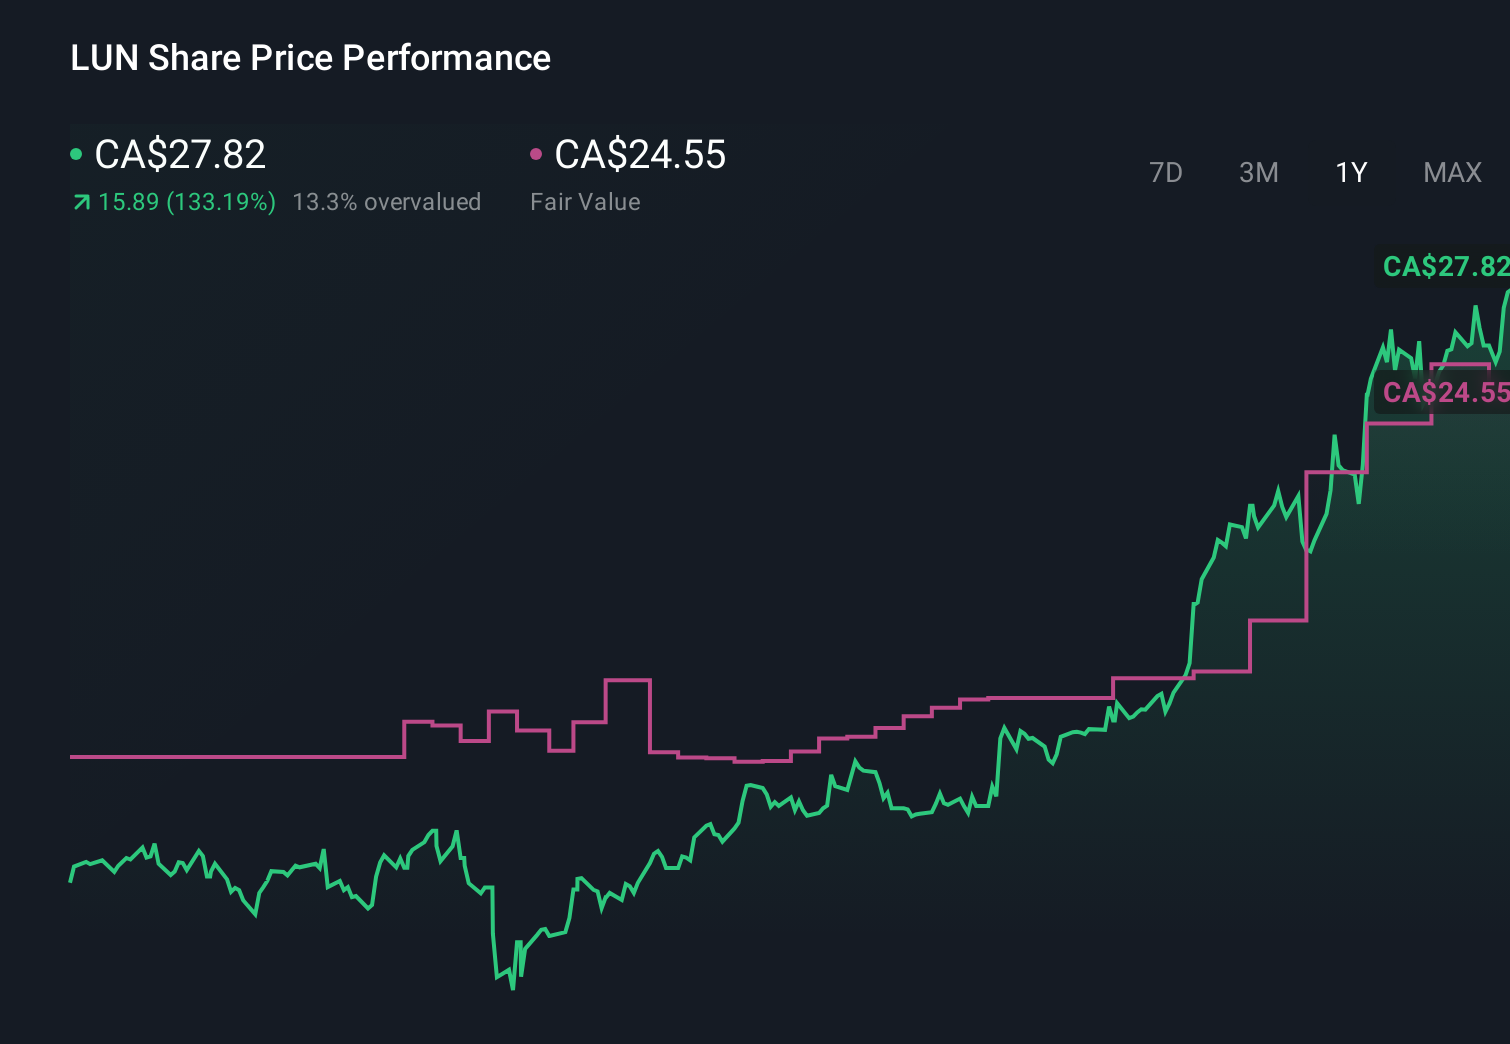
Earlier we mentioned that there is an even better way to understand valuation, so let us introduce you to Narratives, a simple way to connect the story you believe about a company with a concrete financial forecast and a Fair Value estimate. On Simply Wall St’s Community page, Narratives let you spell out your view on Lundin Mining’s projects, risks and metal price cycles, then translate that view into assumptions for future revenue, earnings and margins. The platform turns those assumptions into a Fair Value that you can compare directly with today’s share price to consider whether Lundin Mining looks like a buy, hold or sell, and it automatically updates when new news, earnings or guidance arrive. For example, one optimistic Lundin Mining Narrative might assume stronger copper demand, rising margins near 16 percent and a Fair Value around CA$27.52, while a more cautious Narrative might focus on legal and regional risks, lower earnings closer to the most bearish analyst expectations and a Fair Value nearer the bottom of the current target range, showing how different perspectives lead to very different but transparent conclusions.
Do you think there's more to the story for Lundin Mining? Head over to our Community to see what others are saying!
This article by Simply Wall St is general in nature. We provide commentary based on historical data and analyst forecasts only using an unbiased methodology and our articles are not intended to be financial advice. It does not constitute a recommendation to buy or sell any stock, and does not take account of your objectives, or your financial situation. We aim to bring you long-term focused analysis driven by fundamental data. Note that our analysis may not factor in the latest price-sensitive company announcements or qualitative material. Simply Wall St has no position in any stocks mentioned.
Have feedback on this article? Concerned about the content? Get in touch with us directly. Alternatively, email editorial-team@simplywallst.com