
 Nasdaq
 华尔街日报
华尔街日报Is Uber Still Attractive After 2025 Rally and Expansion in Advertising and Travel Partnerships?
- If you have ever wondered whether Uber Technologies is still a buy after its huge run, you are not alone. This breakdown will help you decide if the current price actually makes sense.
- Even after a recent pullback of 6.8% over the last week and 11.4% over the last month, the stock is still up 25.6% year to date and 30.6% over the past year, with a massive 221.9% gain over three years that keeps longer term investors firmly in the green.
- Recent headlines have focused on Uber cementing its position in both ride hailing and delivery, from expanding its advertising business to deepening partnerships that integrate Uber directly into travel and event planning apps. At the same time, regulatory debates and ongoing competition in key markets are shaping how investors think about its long term growth and risk profile.
- On our checks, Uber scores a perfect 6/6 valuation score. This suggests it screens as undervalued across all our metrics, and in the rest of this article we will walk through multiple valuation approaches before finishing with a more powerful way to judge what the stock is really worth.
Approach 1: Uber Technologies Discounted Cash Flow (DCF) Analysis
A Discounted Cash Flow model estimates what a business is worth today by forecasting the cash it can generate in the future and discounting those cash flows back to their value in the present.
For Uber Technologies, the model starts with last twelve months Free Cash Flow of about $8.7 billion and projects this to keep expanding as the business scales. Analyst estimates and Simply Wall St extrapolations suggest Free Cash Flow could reach roughly $23.4 billion by 2035, with notable milestones such as about $10.7 billion in 2026 and $16.5 billion by 2029. These forecasts are based on a 2 Stage Free Cash Flow to Equity approach, which assumes a faster growth phase followed by a more mature period.
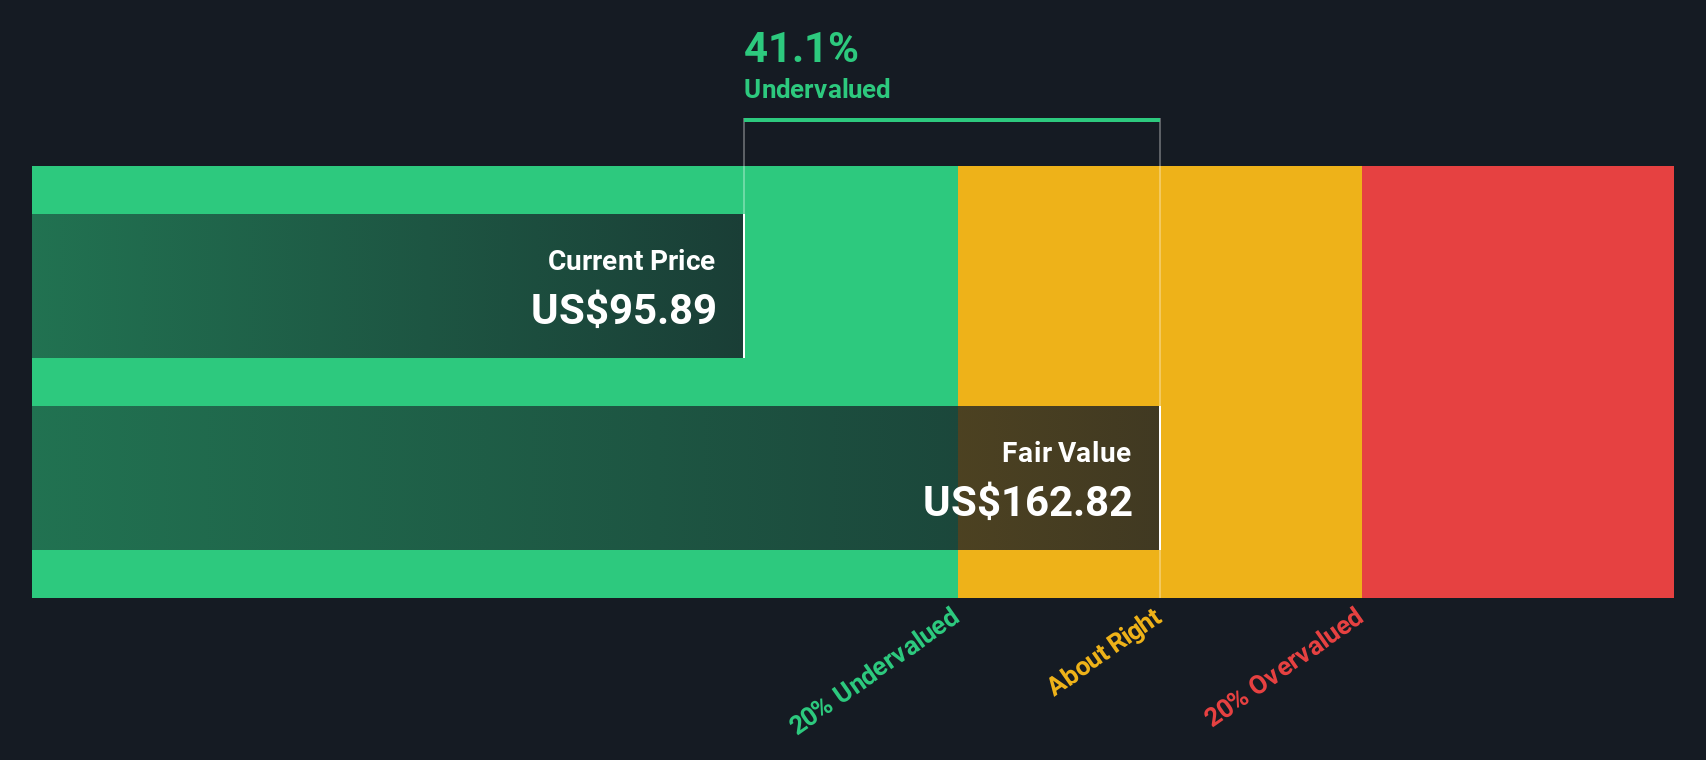
Discounting these future cash flows back to today implies an intrinsic value of approximately $167.31 per share. Compared with the current market price, this points to the shares trading at a 52.6% discount, indicating they are materially undervalued on this metric.
Result: UNDERVALUED
Our Discounted Cash Flow (DCF) analysis suggests Uber Technologies is undervalued by 52.6%. Track this in your watchlist or portfolio, or discover 913 more undervalued stocks based on cash flows.
Approach 2: Uber Technologies Price vs Earnings
For profitable companies like Uber, the Price to Earnings (PE) ratio is a useful way to gauge value, because it links what investors are paying directly to the profits the business is currently generating. As a rule of thumb, faster and more reliable earnings growth, combined with lower perceived risk, can justify a higher PE, while slower growth or higher uncertainty usually calls for a lower, more conservative multiple.
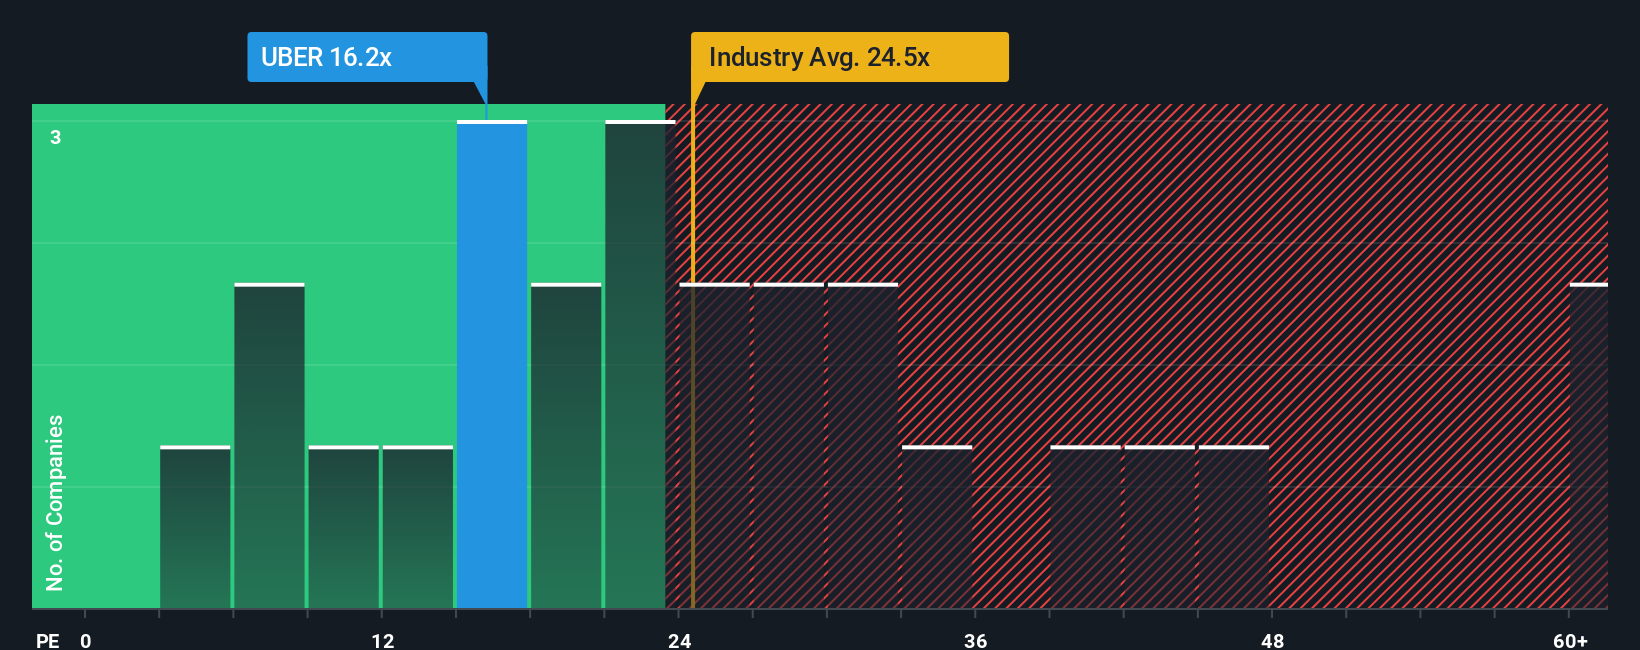
Uber currently trades on a PE of about 9.9x, which is well below both the broader Transportation industry average of roughly 31.1x and an even richer peer average of around 64.9x. To go a step further, Simply Wall St also calculates a proprietary “Fair Ratio” of 14.1x for Uber. This is an estimate of the PE you might expect given its specific mix of earnings growth prospects, margins, industry, market cap and risk profile.
This Fair Ratio is more informative than a simple comparison with peers or the sector, because it is tailored to Uber’s fundamentals rather than assuming that all companies in the space deserve similar valuations. With the actual PE of 9.9x sitting comfortably below the Fair Ratio of 14.1x, Uber still screens as undervalued on this metric.
Result: UNDERVALUED
PE ratios tell one story, but what if the real opportunity lies elsewhere? Discover 1463 companies where insiders are betting big on explosive growth.
Upgrade Your Decision Making: Choose your Uber Technologies Narrative
Earlier we mentioned that there is an even better way to understand valuation, so let us introduce you to Narratives, a simple way to connect your view of Uber’s story to a set of numbers like future revenue, earnings, margins and a resulting Fair Value, then compare that Fair Value to today’s share price to decide whether you want to buy, hold or sell.
On Simply Wall St’s Community page, millions of investors can build and share these Narratives by setting their own assumptions and price targets. The platform will keep them up to date automatically as new earnings, news or guidance come in so your thesis is always based on the latest information.
For Uber, one investor Narrative might assume slower growth and tighter margins, leading to a Fair Value near $75 per share and a preference to wait for a lower entry point. Another might expect stronger long term autonomous and platform economics, supporting a Fair Value around $112 and a view that the current price still offers upside.
For Uber Technologies however we will make it really easy for you with previews of two leading Uber Technologies Narratives:
Fair value: $112.06 per share
Implied undervaluation vs last close: 29.2%
Revenue growth assumption: 14.56%
- Assumes continued expansion of Uber's global user base, with cross platform integration between Mobility, Delivery, and memberships like Uber One driving higher spending and retention.
- Expects potential long term upside from autonomous vehicles, electrification partnerships, and high margin ancillary services such as advertising and platform fees.
- Some analysts estimate fair value around $112 per share. Their views imply around 10% upside from their consensus target versus the current price, even after factoring in moderating margins and execution risks.
Fair value: $75.00 per share
Implied overvaluation vs last close: 5.7%
Revenue growth assumption: 4.2%
- Views Uber's current market cap as already reflecting optimistic long term growth expectations, potential AV benefits, and margin expansion, which in this view leaves limited room for additional upside.
- Projects 2030 revenue of about $65 billion to $70 billion with EBITDA of $14 billion to $15 billion, and concludes this supports a lower equity value than today.
- Estimates fair value at roughly $75 per share and identifies a more attractive entry range of $65 to $75 versus the current share price.
Do you think there's more to the story for Uber Technologies? Head over to our Community to see what others are saying!

This article by Simply Wall St is general in nature. We provide commentary based on historical data and analyst forecasts only using an unbiased methodology and our articles are not intended to be financial advice. It does not constitute a recommendation to buy or sell any stock, and does not take account of your objectives, or your financial situation. We aim to bring you long-term focused analysis driven by fundamental data. Note that our analysis may not factor in the latest price-sensitive company announcements or qualitative material. Simply Wall St has no position in any stocks mentioned.
Have feedback on this article? Concerned about the content? Get in touch with us directly. Alternatively, email editorial-team@simplywallst.com