
 Nasdaq
 华尔街日报
华尔街日报Does Merck’s Share Price Around 100 Offer Long Term Value in 2025?
How Merck's Recent Performance Frames the Valuation Story
With Merck’s share price hovering just above the 100 dollar mark, many investors are wondering whether they are looking at a solid long term compounder or a stock that has already priced in most of its upside. The recent performance numbers offer a useful starting point for framing that valuation debate.
Over the last week, Merck has inched up around 0.8%, adding to a stronger 6.4% gain over the past month and a more modest 1.9% return year to date. Stretch that lens out further, and the stock’s 7.0% return over the last year and 55.0% gain over five years highlight a business that has rewarded patient shareholders, even if the 3 year return of around minus 1.0% shows that the ride has not been perfectly smooth.
Those mixed return profiles, strong over the long run but bumpy in the medium term, often signal that the market is still recalibrating its expectations around Merck’s growth pipeline and risk profile. That is exactly why a structured look at valuation, grounded in fundamentals rather than short term price swings, is particularly useful here.
Find out why Merck's 7.0% return over the last year is lagging behind its peers.
Approach 1: Merck Discounted Cash Flow (DCF) Analysis
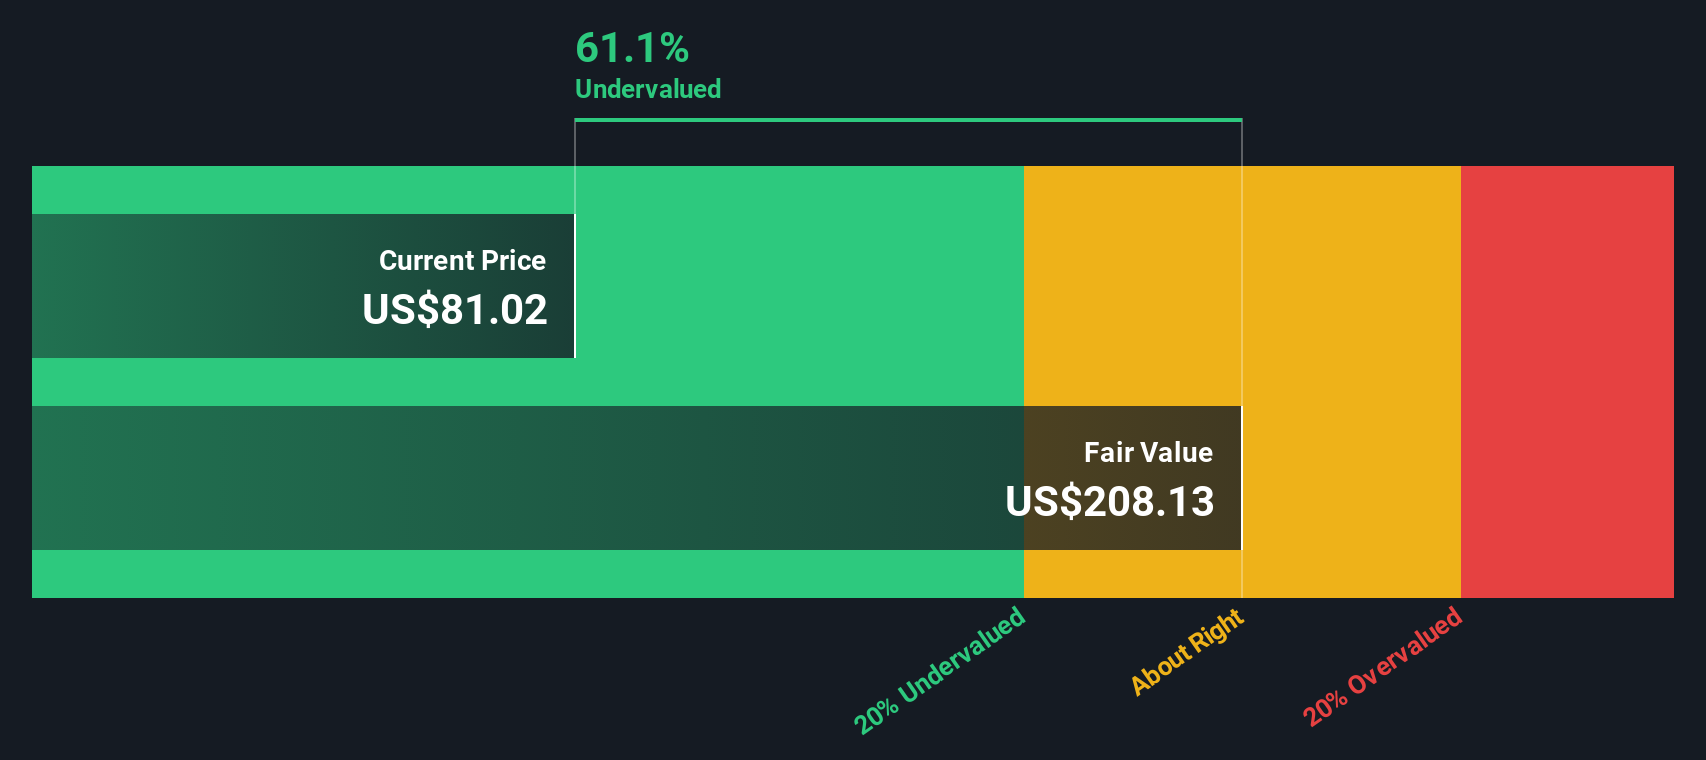
A Discounted Cash Flow model estimates what a company is worth by projecting future cash flows and discounting them back to today in present value terms. For Merck, the 2 Stage Free Cash Flow to Equity approach starts from its last twelve month Free Cash Flow of about $13.1 billion and then layers on analyst forecasts and longer term extrapolations.
Analysts see Merck’s Free Cash Flow rising to roughly $20.0 billion by 2026 and $26.4 billion by 2028. Further projections, based on Simply Wall St estimates, point to around $25.5 billion by 2035 as growth moderates. Rolling these cash flows forward and discounting them back, the model arrives at an intrinsic value of about $215 per share.
With the stock trading just above $100, the DCF output implies roughly a 53.0% discount to fair value. This suggests a wide margin of safety if the cash flow trajectory materializes broadly as expected.
Result: UNDERVALUED
Our Discounted Cash Flow (DCF) analysis suggests Merck is undervalued by 53.0%. Track this in your watchlist or portfolio, or discover 913 more undervalued stocks based on cash flows.
Approach 2: Merck Price vs Earnings
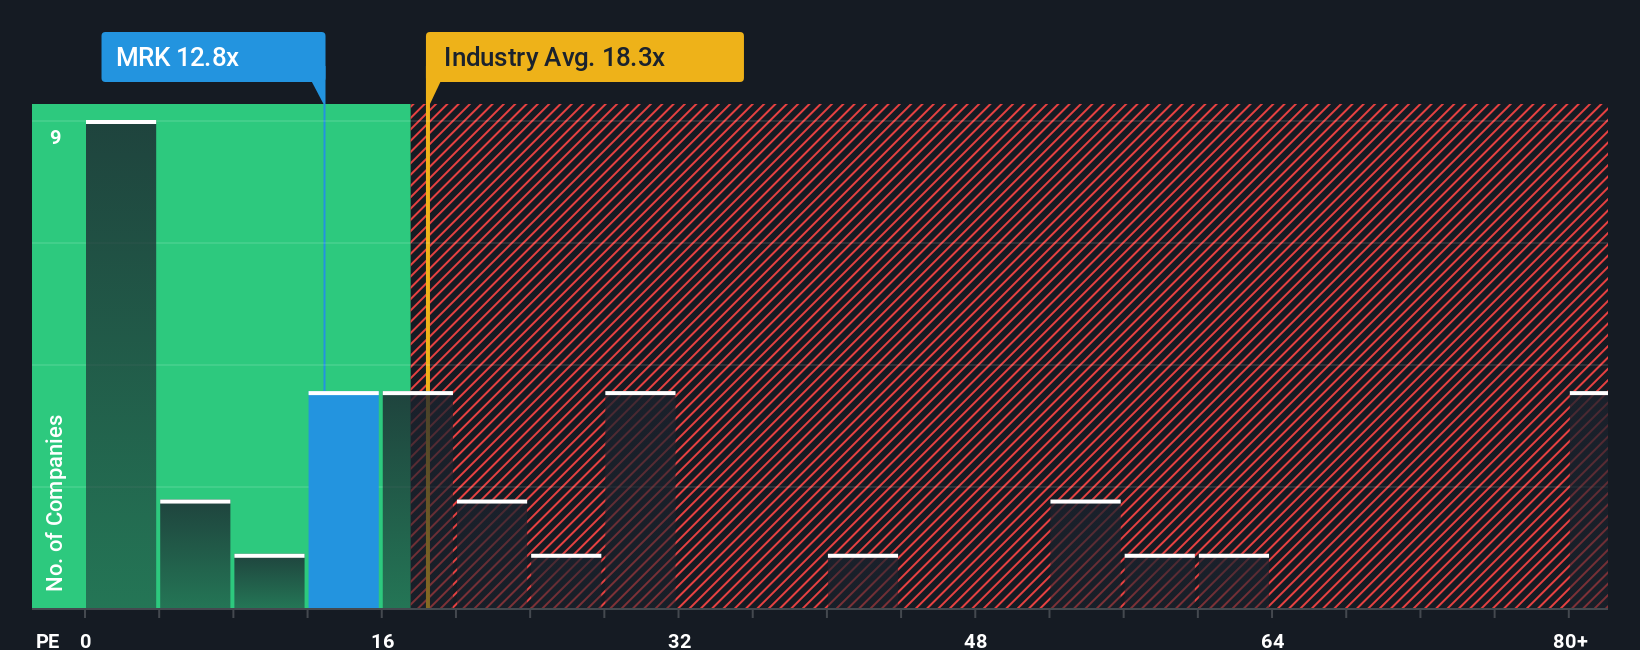
For a mature, profitable business like Merck, the Price to Earnings (PE) ratio is a natural yardstick because it links what investors pay directly to the company’s current earnings power. In general, faster growing and lower risk companies can justify higher PE ratios, while slower growth or higher uncertainty usually calls for a lower, more conservative multiple.
Merck currently trades on a PE of about 13.2x, which is meaningfully below both the Pharmaceuticals industry average of roughly 19.8x and a peer group average near 18.3x. On those simple comparisons alone, the stock looks inexpensive relative to its sector and competitors.
Simply Wall St’s Fair Ratio takes this a step further. It is a proprietary estimate of what Merck’s PE should be, after adjusting for its earnings growth outlook, profitability, industry, market cap and key risks. This makes it more tailored than blunt peer or industry comparisons. For Merck, the Fair Ratio is around 30.9x, well above the current 13.2x multiple, which suggests that the market price may be low relative to these fundamentals.
Result: UNDERVALUED
PE ratios tell one story, but what if the real opportunity lies elsewhere? Discover 1463 companies where insiders are betting big on explosive growth.
Upgrade Your Decision Making: Choose your Merck Narrative
Earlier we mentioned that there is an even better way to understand valuation, so let us introduce you to Narratives, a simple tool on Simply Wall St’s Community page that lets you attach a clear story to your numbers. You can link what you believe about Merck’s products, competitive position and risks to specific forecasts for revenue, earnings and margins. The platform then translates those inputs into a Fair Value you can compare with today’s price to decide whether to buy, hold or sell. It also keeps updating those Narratives dynamically as new news or earnings arrive. For example, a bullish Merck investor might build a Narrative closer to the 141 dollar analyst target with strong pipeline uptake and resilient margins. A more cautious investor might lean toward the 82 dollar bear case that assumes slower growth and more patent pressure, with each using the same framework but different assumptions to reach their own, data driven view of what the stock is really worth.
Do you think there's more to the story for Merck? Head over to our Community to see what others are saying!

This article by Simply Wall St is general in nature. We provide commentary based on historical data and analyst forecasts only using an unbiased methodology and our articles are not intended to be financial advice. It does not constitute a recommendation to buy or sell any stock, and does not take account of your objectives, or your financial situation. We aim to bring you long-term focused analysis driven by fundamental data. Note that our analysis may not factor in the latest price-sensitive company announcements or qualitative material. Simply Wall St has no position in any stocks mentioned.
Have feedback on this article? Concerned about the content? Get in touch with us directly. Alternatively, email editorial-team@simplywallst.com